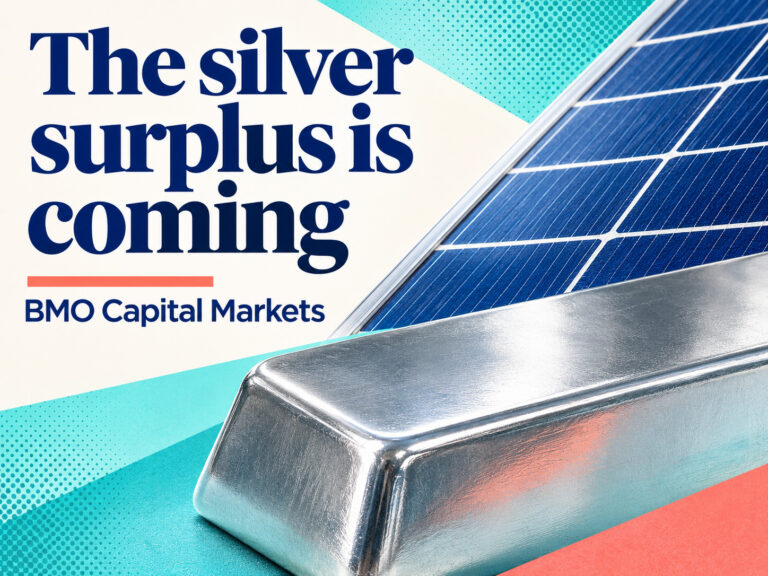
Solar panels are using much less silver, and some forecasters now expect the market to tip from shortage to surplus. The official 2026 forecast still shows a deficit. What decides it may be how much silver investors are willing to hold.
Silver now trades at Silver per ounce: $48.71 (−2.63% today) Live silver price →, far below the record of about $121.60 an ounce it set on January 29. Its highest daily close on record is Silver's highest daily close on record: $115.08 per ounce, on 26 January 2026. (Daily closes since 2000.) Silver price history →. Late in October it fell below $50 for the first time since November 2025, and on November 11 it was trading near $52.67.
Indian buyers have seen the same fall. Silver futures on the Multi Commodity Exchange reached as high as Rs 4,20,048 per kilogram on January 29. Corgano’s live India price is Silver per kilo: ₹1,47,648 (−2.63% today) Silver rate in India today →.
Most of the recent selling has had to do with interest rates. When silver broke below $50 at the end of October, the trigger was rising energy costs and stubborn inflation, which strengthened bets that US rates would stay high. But under the price swings is a slower question, and it starts with solar panels.
Solar is using less silver
Solar has been the main source of growth in silver demand. By BMO Capital Markets’ count, it accounted for 58% of the increase in silver consumption since 2020. Now that’s going into reverse. BMO said solar silver demand is “likely past its peak,” for two reasons: installations are levelling off, and manufacturers keep cutting the amount of silver in each panel.
The Silver Institute’s figures show how fast. Silver used in solar fell 6% in 2025 to 186.6 million ounces. It’s forecast to fall another 19% this year, to about 151 million ounces, even though more panels will be installed. In the Institute’s words: “While global solar installations are expected to continue rising, ongoing thrifting and outright substitution away from silver will result in falling silver PV demand.” J.P. Morgan went further in August, putting the possible drop this year closer to 30%, or about 60 million ounces.
There’s an irony here. The rally itself sped this up. As BMO sees it, silver’s climb to $120 created a new source of weakness: the more silver costs, the harder panel makers work to use less of it, or to switch to copper.
A deficit now, a surplus later?
Forecasters agree that solar demand is falling. They disagree about what that does to the market’s balance, and when.
The official forecast still shows a shortage. The Silver Institute’s World Silver Survey, published in April and researched by Metals Focus, expects a sixth straight deficit in 2026 of 46.3 million ounces, up from 40.3 million in 2025. That’s despite total demand falling 2% to about 1.11 billion ounces. The reason is that supply isn’t growing much: mine output is roughly flat. Industrial demand is forecast to fall 3% to 639.6 million ounces, while physical investment in coins, bars and funds is expected to rise 20% to 227 million ounces.
Others think the gap is closing. In an October interview, Matthew Piggott, Metals Focus’s director of gold and silver, put this year’s shortfall at a smaller 35.4 million ounces. He forecast a surplus of 37.3 million ounces in 2027. BMO looks further out: “On our estimates, the consumption surplus rises to a historical record high by 2030, driven principally by the reversal in solar demand.”
The Silver Institute’s interim review, usually published in mid-November, will show whether its official 2026 forecast moves.
The investment question
Much of the disagreement comes down to how you count investors. The Silver Institute counts coins, bars and fund holdings as demand. BMO prefers to count only consumption, the silver that’s used up in products. Investors aren’t end users: they can sell their silver back into the market. Counted that way, BMO forecasts a physical surplus that grows over the coming years.
That makes investors the swing factor. “For silver not merely to hold today’s elevated price but to continue marching higher while solar demand contracts, investors will need to absorb an unprecedented quantity of surplus metal at an increasingly high dollar cost,” BMO’s analysts wrote this week. “The bull case increasingly requires investment demand not just to remain strong, but to remain exceptionally strong for years.”
BMO also expects a growing surplus to show up in the gold-silver ratio, the number of ounces of silver that one ounce of gold buys. It argues that periods of surplus have historically pushed the ratio higher. Today it stands at Gold/silver ratio: 79.7 — one ounce of gold buys 79.7 ounces of silver. Gold/silver ratio since 1968 →.
What to watch
Four things will shape the debate over the coming months:
- the Silver Institute’s interim review;
- solar installations: BloombergNEF recently cut its forecast for this year to 584 gigawatts;
- the Federal Reserve’s December 9 decision;
- whether investors keep adding to coins, bars and funds, or start selling.
If solar keeps cutting back and investors pull out at the same time, the case for a deficit would weaken quickly. If investment holds up, the official forecasts may hold up too.
Sources
- Kitco News, BMO says silver’s solar boom is fading, investment demand unlikely to compensate (November 11, 2026)
- Kitco News, BMO warns investors that the gold/silver ratio could be nearing a historic bottom (January 15, 2026)
- Silver Institute and Metals Focus, World Silver Survey 2026 (April 15, 2026), as reported by MINING.COM and Crux Investor
- Silver Institute 2026 outlook (February 2026), as reported by Advisor Perspectives
- Kitco, Why the silver price case now rests on investors (Metals Focus interview, BloombergNEF forecast)
- GoldSilver, silver supply analysis (J.P. Morgan’s August revision)
- Trading Economics, Silver at 2025 lows (October 29–30, 2026)
- Motilal Oswal, Silver price drops 15% on MCX (January 30, 2026)
- Crux Investor, January 29 record of $121.58
- USAGOLD, daily report, November 11, 2026
- Live prices, record close and the gold-silver ratio: Corgano Silver Price
This article is for general information only. It is not investment, financial, tax or legal advice, and it is not a recommendation or an offer to buy or sell gold, silver, bitcoin or any other asset or security. Prices and figures can be delayed, change quickly and may contain errors. Forecasts and opinions quoted are those of the people and organizations named, not ours, and are not guarantees of future results. Investing involves risk, including the loss of the money you invest, and past performance does not predict future returns. Do your own research and consider speaking with a licensed financial adviser before making any financial decision.