Silver has fallen 8% this week and is now trading at the lower edge of a falling channel that has framed its decline since mid-September. Its momentum readings are oversold, and its trend reading is very strong. There is little support below it: the nearest weekly support level is 27% lower. Here is what the chart shows.
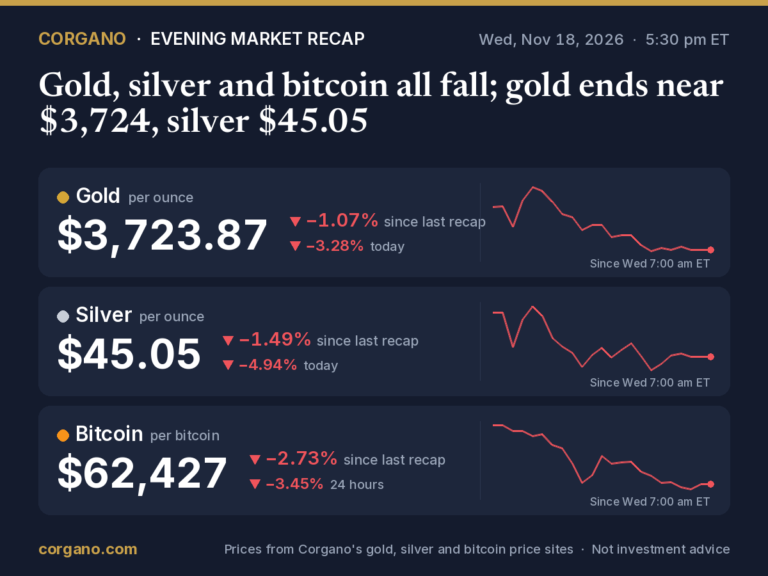
Silver futures traded at $44.97 an ounce at 3 p.m. Eastern time on Wednesday, November 18, and spot silver at $44.84. That’s down from a close of $49.03 last Friday, and from $47.29 on Tuesday. Silver touched $44.66 on Wednesday, its lowest price in the past 52 weeks. It is now 62.9% below the 52-week high of $121.30 reached on January 29, 2026. Silver now trades at Silver per ounce: $45.29 (+0.52% today) Live silver price →.
At the edge of the channel
Since September 16, silver’s daily highs and lows have fallen at about the same rate, between two roughly parallel lines. That is a falling channel. Today its lines are at $44.52 and $50.83, and silver is trading about 1% above the lower one. On the page’s definition, a close outside either line would be the break chart-watchers look for. A close below $44.52 would mean the decline is speeding up beyond the channel. A close above $50.83 would mean it is breaking out of it.
On Wednesday afternoon, silver was also trading below a falling support line on the daily chart, drawn through five swing lows since February 6, 2026. Whether that holds as a break depends on the close.
Little support below
Silver has fallen far enough that the daily chart has no swing low from the past year below the price. The nearest support comes from the weekly chart:
- A rising support line at about $38.47, 14.5% below the price. It runs through 21 swing lows since August 29, 2022, with no weekly close below it in that time.
- Weekly support at $32.86, 26.9% below, where the price turned 9 times since May 2024, as both support and resistance.
The weekly chart still shows a pullback within a longer uptrend. Silver is below its 50-week average ($69.09) but 13.2% above its 200-week average ($39.73). It is now just under its 200-week exponential average ($45.12), the only one of the eight weekly averages close to the price.
A strong downtrend on the daily chart
- Moving averages. The price is below its 50-day average ($57.25), which is below the falling 200-day average ($67.89). The 50-day crossed below the 200-day on July 16, 2026, a “death cross”. The price is below all eight daily averages the page tracks.
- Trend strength. The ADX reads 44.6, which the page calls a very strong trend. Downward moves dominate: −DI 35 against +DI 9.
- MACD is below zero (−2.85) and below its signal line (−2.54), with the gap widening.
- A falling resistance line through five swing highs since January 29 sits at about $51.58, 14.7% above the price.
Oversold, again
Several readings show how far and how fast silver has fallen:
- The 14-day RSI is 27, in the oversold zone (30 or less). The weekly RSI is 31.5.
- The stochastic reading is 6.6 on the daily chart and 6.3 on the weekly, both deep in their lower zones.
- The price is below the lower Bollinger band on both charts: $45.90 daily, $45.92 weekly.
- It is below all three daily pivot supports (S3: $45.54), and at the weekly S2 pivot ($45.00).
Oversold readings have not been a reliable floor for silver this autumn. The RSI fell to 28 on October 29 and on November 3. Five sessions later, silver was 0.1% and 3.1% higher. Then it resumed its fall, and the RSI was back at 29 on November 16, the day silver set a new 52-week low and closed below support at $48.29. Breakdowns have tended to follow through. Silver closed below support at $54.46 on October 23 and was 8.6% lower five sessions later. Every signal and what followed is on Corgano’s silver chart track record.
The levels on the chart
| Level | What it is | vs $44.97 |
|---|---|---|
| $61.04–61.55 | 61.8% retracement; daily resistance (5 swing highs and lows, last October 13) | +36% |
| $57.25–57.91 | 50-day average; 50% retracement | +28% |
| $54.72–54.78 | Daily resistance (5 swing highs and lows, last November 10); 38.2% retracement | +22% |
| about $51.58 | Falling resistance line since January 29 | +14.7% |
| $50.83–50.91 | Top of the falling channel; 23.6% retracement | +13% |
| $48.29 | Former support (2 swing lows), broken on November 16 | +7.4% |
| $46.99 | Former weekly support (2 swing lows), broken in the week of November 16 | +4.5% |
| $44.52 | Bottom of the falling channel | −1.0% |
| about $38.47 | Rising weekly support line since August 2022 (21 touches) | −14.5% |
| $32.86 | Weekly support and resistance (9 touches since May 2024) | −26.9% |
| $26.17 | Weekly support and resistance (18 touches) | −41.8% |
Retracements measure the fall from $71.16 on August 28, 2026, to $44.66 on November 18. That swing is still running, so those levels move each time silver sets a new low. Channel and trend-line levels move a little each day.
Silver moves a lot. Its average daily range over the past 14 sessions is $2.21, or 4.9% of the price, about twice gold’s. The bottom of the channel is less than half a typical day’s move away. The rising weekly line is about three typical days away, and the nearest weekly support level more than five.
What the chart doesn’t tell you
A chart records what the price has done, not why. Silver is moved by the same forces as gold, such as interest-rate expectations and the dollar, and also by industrial demand, from solar panels to electronics. Corgano tracks the drivers every day on why silver is up or down today. Support and resistance levels are places where buyers or sellers stepped in before. They are not guarantees that they will again.
The full analysis updates through the day on Corgano’s silver technical analysis page, and its “what changed” notes are written once a day from the finished candle. More detail:
- the support and resistance levels and how each was formed;
- the moving averages;
- the RSI;
- the pivot points.
Sources
- Corgano, Silver technical analysis (read at 3:00 p.m. ET, November 18, 2026; COMEX silver futures candles)
- Corgano, Silver chart track record
- Corgano silver price history: daily closes for November 13, 16 and 17, 2026
This article is for general information only. It is not investment, financial, tax or legal advice, and it is not a recommendation or an offer to buy or sell gold, silver, bitcoin or any other asset or security. Prices and figures can be delayed, change quickly and may contain errors. Forecasts and opinions quoted are those of the people and organizations named, not ours, and are not guarantees of future results. Investing involves risk, including the loss of the money you invest, and past performance does not predict future returns. Do your own research and consider speaking with a licensed financial adviser before making any financial decision.