Bitcoin has fallen 15% in eight days and is now sitting on a tight cluster of support just above $62,000. A horizontal support level, two rising trend lines, the lower Bollinger band and three pivot levels all fall within 2% below the price. Its momentum readings are oversold, and it trades below every moving average the page tracks. Here is what the chart shows.
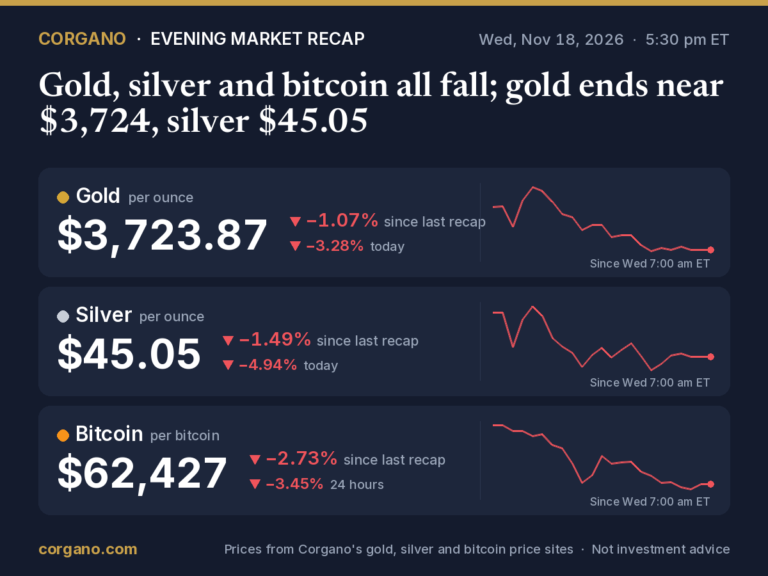
Bitcoin traded at $62,835 at the end of Wednesday, November 18, as the daily candle rolled over at midnight UTC (7 p.m. Eastern). That is down 3.8% this week, from $65,305 at Sunday’s close, and down 14.8% from $73,720 on November 10. Last week bitcoin lost 12.4%. It is now 35.8% below its 52-week high of $97,861, set on January 14, 2026, and 8.8% above its 52-week low of $57,748, set on July 1. Bitcoin now trades at 1 BTC: $62,596 (−2.57% 24h) Live bitcoin price →.
Five support readings within 2%
The most notable feature of bitcoin’s chart is how many separate measures point to the same narrow band of prices, between about $61,600 and $62,400:
- Daily support at $62,214, 1.0% below the price. Bitcoin has turned at this level 12 times since February 24, as both support and resistance.
- A rising support line on the daily chart at about $62,030, 1.3% below. It runs through seven swing lows since July 8, 2026, with no daily close below it in that time.
- The lower Bollinger band at $61,909, 1.5% below. The price is near it.
- A rising support line on the weekly chart at about $61,811, 1.6% below. It runs through six swing lows since November 21, 2022, with no weekly close below it.
- Pivot levels: the daily S2 at $62,434, the monthly S3 at $62,411 and the daily S3 at $61,583.
None of these levels is a promise. They are prices where buyers have stepped in before, or lines drawn through past lows. But when several of them line up, a close below the whole band is the kind of break chart-watchers notice. On the page’s rules, a break counts when a close goes beyond a line by more than a quarter to half of the average daily range. For bitcoin today, that is about $650 to $1,300.
Below the cluster
If the band gives way, the next levels on the chart are:
- Weekly support at $60,441, 3.8% below the price, where bitcoin has turned eight times. It was tested in the week of November 16.
- The weekly S1 pivot at $59,714, 5.0% below.
- Daily support at $58,592, 6.8% below, formed by four swing lows and last tested on July 2.
- The 52-week low of $57,748, set on July 1, 8.1% below.
- Weekly support at $53,158, 15.4% below, where bitcoin has turned six times.
Weekly trend lines on bitcoin’s chart have been broken and redrawn before. On June 28, 2026, bitcoin closed the week below a rising support line drawn from the same November 2022 low, then went on to set its 52-week low on July 1. The line the page shows now runs through a different set of lows, and no weekly close has fallen below it.
The trend has turned down
- Moving averages. Bitcoin is below all eight daily averages the page tracks, and below all eight weekly averages. Its 50-day average ($78,575) is still above its 200-day average ($72,719), as it has been since the golden cross on September 8, 2026, but the price is 20.0% below the 50-day and 13.6% below the 200-day. Bitcoin closed below the 200-day average on November 12.
- The 200-week average, at $68,174, is 8.5% above the price; bitcoin is 7.8% below it. Bitcoin is also below the 200-week exponential average ($69,611).
- Trend strength. The ADX reads 38.3, a trending market. Downward moves dominate: −DI 38 against +DI 6. On November 12, the page’s daily trend reading changed from “pullback in uptrend” to “weakening”. The weekly reading is also “weakening”.
- MACD is below zero (−4,205) and below its signal line (−3,171), though the gap is shrinking.
- The double bottom has been undone. A double bottom on the weekly chart, at $60,074 and $57,748, was completed on September 21 with a close above its $82,792 neckline. Bitcoin has since fallen back well below the neckline, so the page says the pattern no longer describes the chart.
- Retracement. The last major swing ran from $57,748 on July 1 to $87,364 on September 21. Bitcoin has given back 83% of it, beyond the 78.6% retracement at $64,086.
Oversold, with a mixed record
Several readings show how far and how fast bitcoin has fallen:
- The 14-day RSI is 21.7, deep in the oversold zone (30 or less). The weekly RSI is 36.6.
- The daily stochastic reading is 11.4, in its lower zone.
- The price is near the lower Bollinger band on both the daily chart ($61,909) and the weekly chart ($57,141).
Corgano’s bitcoin chart track record shows that oversold readings have not been a reliable short-term floor. Since November 17, 2024, the daily RSI has fallen to 30 or less nine times. Five days later, bitcoin was higher only three times out of nine, with a median move of −3.5%. Over 60 days the record looks different: bitcoin was higher six times out of eight, with a median gain of 3.1%.
The two readings in June show the range. On June 2, the RSI fell to 22 at $66,704, and bitcoin was 5.2% lower five days later and 5.9% lower 60 days later. On June 30, the RSI fell to 30 at $58,559, the day before the 52-week low, and bitcoin was 8.5% higher five days later and 33.6% higher 60 days later. The most recent reading, on November 12 at $71,343, was followed by a 9.0% fall over five days.
Breaks of support have tended to follow through. The page has recorded 48 closes below the nearest support level since November 2024. In 32 of them, bitcoin was lower 20 days later. Over any 20 days in the same period, bitcoin was higher 46% of the time.
The levels on the chart
| Level | What it is | vs $62,835 |
|---|---|---|
| $78,575 | 50-day average | +25.1% |
| $74,945 | Daily resistance (11 swing highs and lows, last November 12) | +19.3% |
| $72,719 | 200-day average | +15.7% |
| $70,740 | Daily resistance (8 swing highs and lows), broken on November 13 | +12.6% |
| $69,061 | 61.8% retracement | +9.9% |
| $68,174 | 200-week average | +8.5% |
| $65,455 | Daily resistance (14 swing highs and lows since February 12) | +4.2% |
| $64,086 | 78.6% retracement | +2.0% |
| $62,434–62,411 | Daily S2 and monthly S3 pivots | −0.6% to −0.7% |
| $62,214 | Daily support (12 touches since February 24) | −1.0% |
| about $62,030 | Rising daily support line since July 8 | −1.3% |
| $61,909 | Lower Bollinger band, daily | −1.5% |
| about $61,811 | Rising weekly support line since November 2022 (6 touches) | −1.6% |
| $61,583 | Daily S3 pivot | −2.0% |
| $60,441 | Weekly support (8 touches) | −3.8% |
| $58,592 | Daily support (4 swing lows, last July 2) | −6.8% |
| $57,748 | 52-week low (July 1) | −8.1% |
| $53,158 | Weekly support (6 touches) | −15.4% |
Percentages are measured from the latest close of $62,835. Trend-line levels move a little each day. Pivot levels reset each day, week and month.
Bitcoin moves a lot. Its average daily range over the past 14 days is $2,586, or 4.1% of the price, and its average weekly range is 10.2%. The whole support cluster sits within half a typical day’s move of the price. The 52-week low is about two typical days away.
What the chart doesn’t tell you
A chart records what the price has done, not why. This week, bitcoin has fallen alongside gold and silver as markets priced in a Federal Reserve rate hike in December. CME FedWatch put the odds at about 95% at Tuesday’s close, according to 24/7 Wall St. The dollar index rose to its highest level since April 2025, Benzinga reported. Fund flows matter too. Corgano tracks the drivers every day on why bitcoin is up or down today. Support and resistance levels are places where buyers or sellers stepped in before. They are not guarantees that they will again.
The full analysis updates through the day on Corgano’s bitcoin technical analysis page, and its “what changed” notes are written once a day from the finished candle. More detail:
- the support and resistance levels and how each was formed;
- the moving averages, with every golden and death cross of the past ten years;
- the RSI, with every oversold spell and what followed;
- the pivot points.
Sources
- Corgano, Bitcoin technical analysis (read at 00:17 UTC, November 19, 2026; BTC-USD daily candles, 00:00–24:00 UTC, from Yahoo Finance)
- Corgano, Bitcoin chart track record (calls since November 17, 2024)
- Corgano bitcoin price history: daily closes for November 8, 10 and 15, 2026
- 24/7 Wall St., Traders now see a 95% chance the Fed hikes rates in December
- Benzinga, Stock market today, November 18
This article is for general information only. It is not investment, financial, tax or legal advice, and it is not a recommendation or an offer to buy or sell gold, silver, bitcoin or any other asset or security. Prices and figures can be delayed, change quickly and may contain errors. Forecasts and opinions quoted are those of the people and organizations named, not ours, and are not guarantees of future results. Investing involves risk, including the loss of the money you invest, and past performance does not predict future returns. Do your own research and consider speaking with a licensed financial adviser before making any financial decision.