Gold’s slide has brought it back to one of the most important lines on its chart: a rising support line on the weekly chart that has held since October 2023. On Wednesday morning, gold was trading below it. The daily trend is down and momentum is at levels many traders call oversold. Here is what the chart shows, level by level.
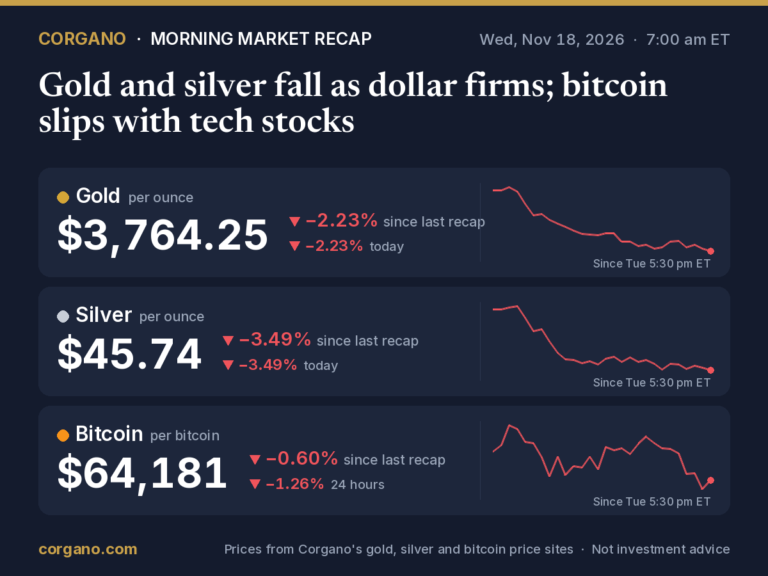
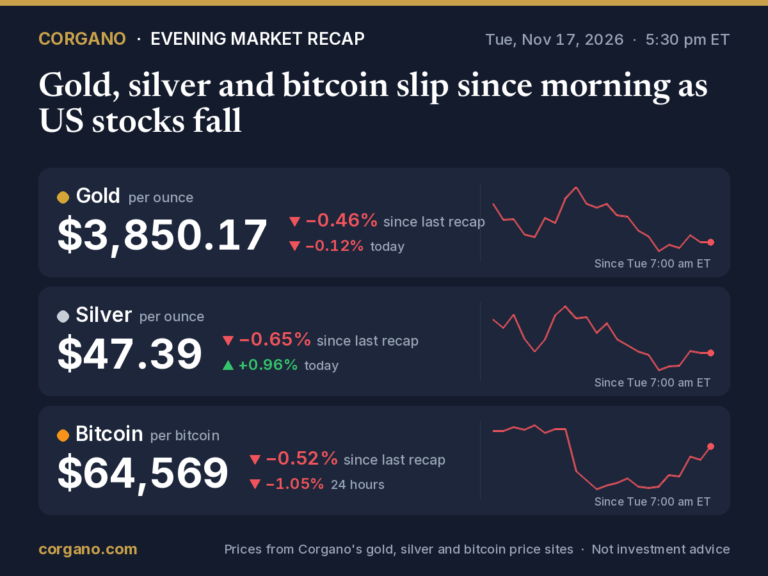
Gold futures traded at $3,759 an ounce early on Wednesday, November 18, and spot gold at about $3,783. That’s down from a close of $3,886.30 last Friday and $3,864.20 on Tuesday. Early on Wednesday, gold touched $3,745, its lowest price in the past 52 weeks. It is now 32.7% below the 52-week high of $5,586 reached on January 29, 2026. Gold now trades at Gold per ounce: $3,734.11 (−3.01% today) Live gold price →.
The line that has held since 2023
On the weekly chart, a rising support line runs through 12 swing lows since October 2, 2023, with no weekly close below it in that time. It now sits at about $3,841.
Tuesday’s close of $3,864.20 was still above it. On Wednesday morning, gold was trading 2.2% below it. That is not yet a break by the rule Corgano’s chart uses: a weekly close more than $99.71 beyond the line, or below about $3,741 this week. A daily dip under the line counts only as a test. Whether it breaks is decided by Friday’s close.
On 2 October 2023, gold closed at $1,847.20 per ounce. Today's price is 102% higher. Gold prices in October 2023 →The weekly chart still shows a pullback within a longer uptrend. Gold is below its 50-week average ($4,469) but 23% above its 200-week average ($3,056).
A downtrend on the daily chart
The daily chart is in a downtrend by the usual definitions:
- Moving averages. The price is below its 50-day average ($4,144), which is below the 200-day average ($4,458), and the 200-day is falling. The 50-day crossed below the 200-day on July 1, 2026, a “death cross”. The price is below all eight of the daily averages the page tracks, from the 9-day to the 200-day.
- Trend strength. The ADX, which measures how strong a trend is in either direction, reads 28.4. Readings of 25 or more count as trending, and the moves down (−DI 35) have been much stronger than the moves up (+DI 13).
- MACD. At −83.96, it is below zero and below its signal line (−66.24), and the gap is widening.
- Channel. Since September 2, gold has moved in a falling channel. On November 12, when it was identified, the channel ran between $3,827 and $4,132.
Stretched to the downside
Several readings show how far and how fast gold has fallen:
- The 14-day RSI is at 30, the level many traders treat as oversold. The weekly RSI is 34.8.
- The stochastic reading is 6, deep in its lower zone (20 or less).
- The price is below the lower Bollinger band ($3,793), two standard deviations under the 20-day average.
- It is below all three daily pivot supports. The lowest, S3, is $3,783.
These readings describe the size and speed of the drop. They don’t say when it ends, and the chart’s recent record shows why. When the daily RSI last fell to oversold, at 28 on October 30, gold was 4.5% higher five sessions later. But a break the other way didn’t last. On November 4, gold closed above resistance at $3,955. It was 1.8% lower five sessions later, and on November 12 it closed below support at $3,997. A break above a falling resistance line on November 5 also failed. Every past signal and what followed is listed on Corgano’s gold chart track record.
The levels on the chart
Gold has fallen far enough that the daily chart has no swing low from the past year below the price. The nearest supports come from the weekly chart and from trend lines:
| Level | What it is | vs $3,759 |
|---|---|---|
| $4,246–4,250 | Daily resistance (6 swing highs and lows, last October 19) and the 50% retracement of the fall from August | +13% |
| $4,131–4,144 | 38.2% retracement; the 50-day average | +10% |
| $3,983–3,996 | Former support at $3,996 (4 swing lows), broken on November 12; the 23.6% retracement; the 20-day average ($3,986) | +6% |
| about $3,841 | Rising weekly support line since October 2023 (12 touches), being tested | +2.2% |
| about $3,741 | A weekly close below this would count as a break of that line | −0.5% |
| about $3,691 | Falling support line on the daily chart, through 5 swing lows since December 31, 2025 | −1.8% |
| $3,464 | Weekly support and resistance (4 swing highs and lows since April 2025) | −7.8% |
| $3,251 | Weekly support (3 swing lows, last August 2025) | −13.5% |
Retracements measure the fall from $4,755 on August 25, 2026, to $3,745 on November 18. That swing is still running, so those levels move each time gold sets a new low. Trend-line levels move a little each day.
For a sense of scale, gold’s average daily range over the past 14 sessions is $89.88, or 2.4% of the price. Most of the nearby levels are within one or two average days’ movement. The nearest weekly support, $3,464, is 7.8% below.
What the chart doesn’t tell you
A chart records what the price has done. It doesn’t explain why. The reasons are outside the chart: interest-rate expectations, the dollar and real yields, and buying or selling by central banks and funds. Corgano tracks those every day on why gold is up or down today. Support and resistance levels are where buyers or sellers stepped in before. They are not guarantees that they will again.
The full analysis updates through the day on Corgano’s gold technical analysis page, and its “what changed” notes are written once a day from the finished candle. The levels and how each was formed are on the support and resistance page. There are also pages for RSI and pivot points.
Sources
- Corgano, Gold technical analysis (read at 9:02 a.m. ET, November 18, 2026; COMEX gold futures candles)
- Corgano, Gold chart track record
- Corgano gold price history: daily closes for November 13 and 17, 2026
This article is for general information only. It is not investment, financial, tax or legal advice, and it is not a recommendation or an offer to buy or sell gold, silver, bitcoin or any other asset or security. Prices and figures can be delayed, change quickly and may contain errors. Forecasts and opinions quoted are those of the people and organizations named, not ours, and are not guarantees of future results. Investing involves risk, including the loss of the money you invest, and past performance does not predict future returns. Do your own research and consider speaking with a licensed financial adviser before making any financial decision.