Key figures
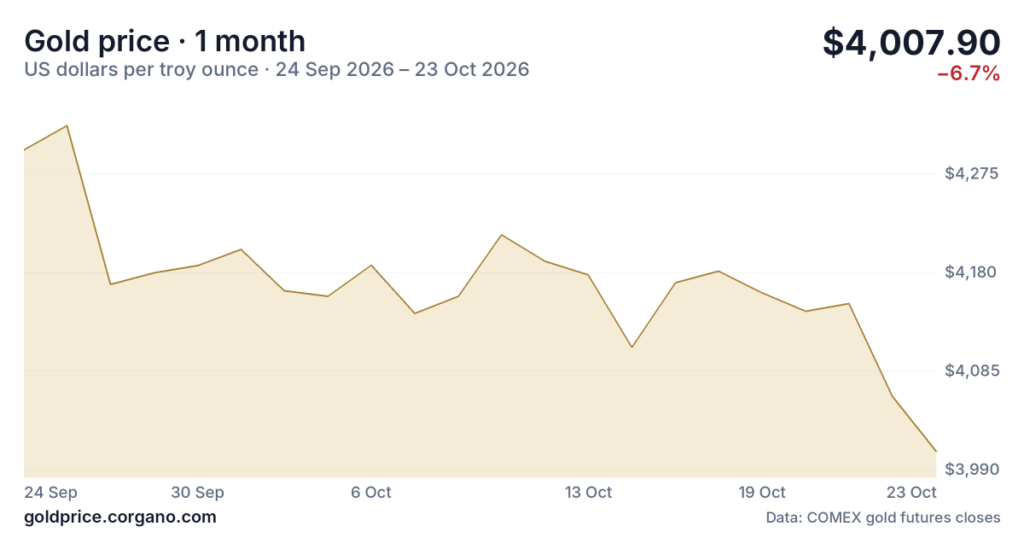
- Gold price, 1 troy ounce: $3,997.89
- Gold change since the previous New York close: −0.65%
- Gold change so far in 2026: −7.9%
- Silver price, 1 troy ounce: $53.94
- Silver change since the previous New York close: −1.21%
- Silver change so far in 2026: −23.1%
- Bitcoin price, 1 bitcoin: $80,412
- Bitcoin change over the past 24 hours: −0.95%
- Bitcoin change so far in 2026: −8.1%
Prices as of October 24, 2026, 3:16 PM ET.
Market overview
Silver fell 1.21% ($0.66) as yields rose by 4 basis points. The VIX rose 2.21%. WTI crude oil rose 3.82%. The S&P 500 fell 0.52%. The US dollar index fell 0.06%. Gold charts vs stocks, dollar and other assets show these movements.
Gold price action
Gold fell 0.65% ($26.14). The price was $3,997.89. Gold is down 4.4% over the past week. The monthly change is down 7.4%. The year-to-date change is down 7.9%. The annual change is down 3.6%. The high was $5,318.40 on 29 January 2026. The low was $3,960.50 on 4 November 2025. Gold is 24.8% below its highest daily close. Live gold price today is available. Gold price every day this month can be viewed. Gold price explanation is available. Gold price forecasts are available.
Silver price action
Silver fell 1.21% ($0.66). The price was $53.94. Silver is down 5.4% over the past week. The monthly change is down 16.2%. The year-to-date change is down 23.1%. The annual change rose 11.3%. The high was $115.08 on 26 January 2026. The low was $46.56 on 27 October 2025. Silver has seen 3 consecutive lower closes. Live silver price today is available. Silver price every day this month is available. Silver price explanation is available. Silver price forecasts are available.
Bitcoin price action
Bitcoin fell 0.95% ($773). The price was $80,412. Bitcoin is down 1.2% over the past week. The monthly change is down 4.7%. The year-to-date change is down 8.1%. The annual change is down 27.6%. The high was $114,472 on 26 October 2025. The low was $58,559 on 30 June 2026. Bitcoin is 35.5% from its highest daily close. Live bitcoin price today is available. Bitcoin price every day this month is available. Bitcoin price explanation is available. Bitcoin price forecasts are available.
Market ratios
The gold/silver ratio was 74.1. The bitcoin/gold ratio was 20.1.
Data: Corgano Gold Price — gold price history, as of November 13, 2026, 22:00 UTC.
Prices and figures come from the Corgano price sites and are indicative. This article describes market moves; it is not investment, tax or financial advice.