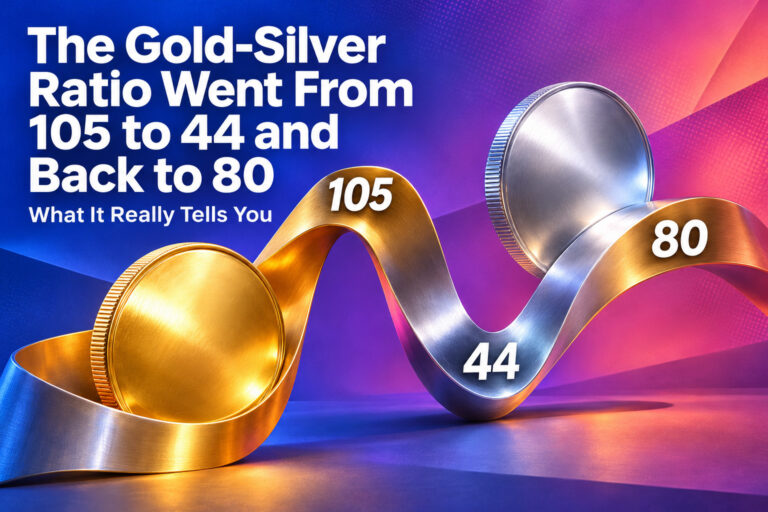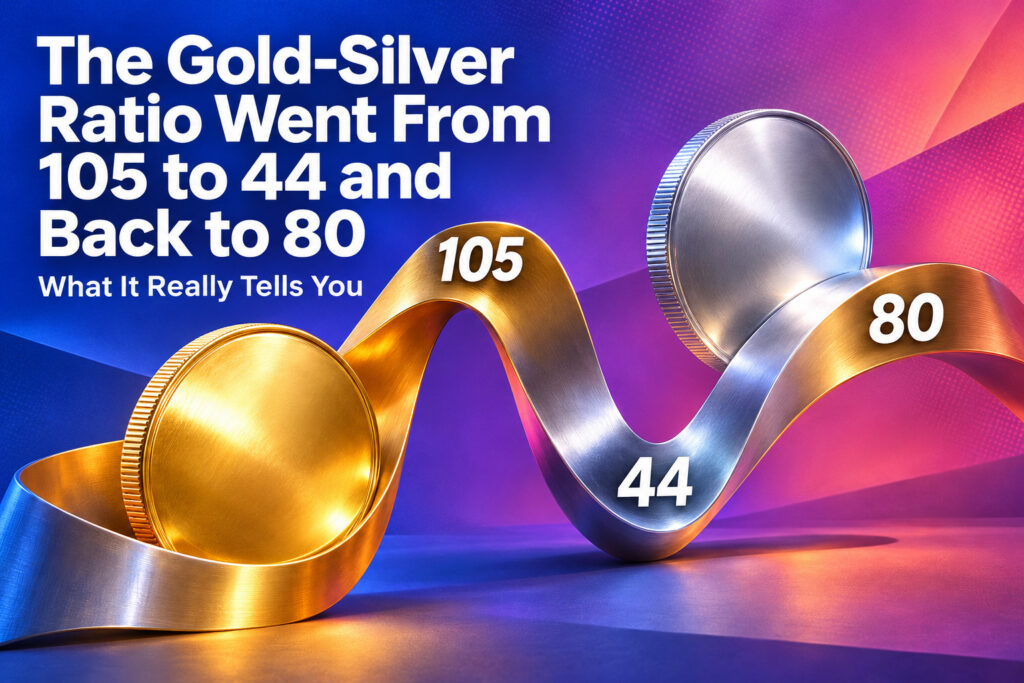
The gold-silver ratio, the number of ounces of silver that one ounce of gold buys, has just had one of the wildest runs in its history. It went from above 105 in April 2025 to 44 in January 2026, then back to about 80 this month. Many people treat it as a gauge of whether silver is cheap. Its history shows that is harder to judge than it looks.
The ratio now stands at Gold/silver ratio: 79.7 — one ounce of gold buys 79.7 ounces of silver. Gold/silver ratio since 1968 →. That’s a long way from January 26, 2026, when silver set its record daily close of $115.08 and the ratio fell to 44.2, its lowest since September 2011. Since then silver has fallen much faster than gold. By November 13, the ratio was back near 80, up from about 74 in mid-October, according to Kitco.
What the ratio is
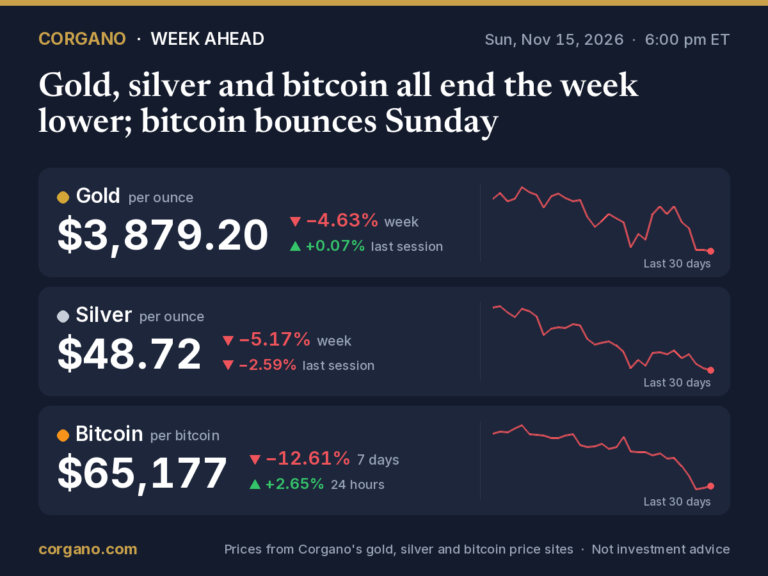
It’s simple arithmetic: the gold price divided by the silver price. With gold near $3,900 and silver near $48.50, as on November 13, one ounce of gold is worth about 80 ounces of silver. A rising ratio means silver is losing ground to gold, and a falling ratio means it’s gaining.
The myth of “16 to 1”
You’ll often hear that gold and silver “should” trade at about 15 or 16 to 1. That idea comes from law, not markets. The US Coinage Act of 1792 fixed the value of silver to gold at 15 to 1, and the Coinage Act of 1834 changed it to 16 to 1. Those were mint ratios, set by government to make coins work. In the 1890s, “free silver at 16 to 1” became a campaign slogan, and William Jennings Bryan ran for president on it in 1896. He lost, and the US moved to a gold standard.
The physical numbers don’t support 16 to 1 either. The world mined about 26,000 tonnes of silver in 2025, according to the US Geological Survey, roughly eight times the 3,300 tonnes of gold it estimates. Over all of history, about 1.8 million tonnes of silver and 224,200 tonnes of gold have been mined, again roughly 8 to 1. But those ratios are by weight, and silver is used up in industry in a way gold isn’t, so neither number sets a “fair” price.
The market ratio since 1968
Since gold and silver have traded freely, the ratio has had no fixed level. Corgano’s daily price data show it averaging very different values in different decades:
| Decade | Average | Low | High |
|---|---|---|---|
| 1968–69 | 20.5 | 14.1 | 26.4 |
| 1970s | 31.7 | 18.1 | 47.6 |
| 1980s | 52.7 | 14.0 | 77.6 |
| 1990s | 73.7 | 38.3 | 100.8 |
| 2000s | 61.6 | 43.7 | 84.5 |
| 2010s | 67.5 | 31.5 | 93.6 |
| 2020s so far | 81.3 | 44.2 | 125.9 |
Daily closes, January 1968 to October 21, 2026.
Over the whole period, the ratio averaged 59. Since 2000 it has averaged about 69, and since 2016 about 80. So whether 80 looks “high” depends on which history you pick. Against the past 10 years, it’s average.
The lows came at silver’s peaks
The ratio’s three deepest lows of the past half-century each came at the top of a silver boom:
- January 1980. The ratio fell to 14.0 at the start of the year, as the Hunt brothers’ attempt to corner silver pushed it to a record $49.45 an ounce in mid-January. By late March, silver had crashed on “Silver Thursday,” and by May the ratio was back at 46.
- April 2011. The ratio hit 31.5 on April 28, the same day silver peaked at $48.70 in London. By the end of 2011 it was 58.5.
- January 2026. The ratio hit 44.2 on January 26, the same day as silver’s record close. By mid-October it was 74, and by mid-November about 80.
In each case, a low ratio was a sign that silver had run far ahead of gold, and in each case the gap closed quickly.
The highs came in moments of fear
The highest readings came at very different moments:
- February 1991, during the Gulf War: 100.8
- November 2008, after the collapse of Lehman Brothers: 84.5
- March 2016: 83.3
- March 18, 2020, as the pandemic hit markets: 125.9, the all-time record
- April 21, 2025, weeks after the US “Liberation Day” tariffs: 105.4
In a crisis, investors tend to buy gold for safety and sell silver, because silver depends more on factories and the economy. In the year after each of these five highs, silver did better than gold, but by very different amounts:
| Ratio high | Silver, next 12 months | Gold, next 12 months | Ratio a year later |
|---|---|---|---|
| February 1991 (100.8) | +16% | −2% | 85.0 |
| November 2008 (84.5) | +105% | +51% | 62.3 |
| March 2016 (83.3) | +24% | +1% | 68.0 |
| March 2020 (125.9) | +124% | +17% | 65.8 |
| April 2025 (105.4) | +135% | +38% | 61.8 |
Five cases is a small sample, and it only looks back from the peak, which no one can identify at the time. The ratio can also stay high for years: after 1991 it averaged 73 through the rest of the decade.
Today’s ratio of about 80 isn’t one of these extremes. It’s close to the average of the past decade.
Why silver swings more than gold
Silver is two things at once. It’s a precious metal, but most of it is used in industry, in solar panels, electronics and electrical parts. The Silver Institute expects industrial uses to take about 640 million ounces this year, more than half of total demand of about 1.11 billion ounces. Gold has a large group of buyers that silver lacks: central banks, which bought 675 tonnes of gold in the first nine months of 2026.
Silver’s market is also much smaller. By Corgano’s rough calculation at today’s prices, the world’s silver mine output in 2025 was worth about $40 billion, against more than $400 billion for gold. A smaller market moves further on the same flows of money.
What forecasters say now
Analysts at Metals Focus said at the end of October that the ratio had risen above 76 for the first time since December 2025, but was still below its 2020–2025 average of 82, and that it has room to move higher. “Silver, by contrast, is viewed more as an industrial commodity and does not enjoy the same quasi-monetary attributes as gold,” they wrote. They noted that the supply squeeze that drove silver to its records has largely disappeared, and expect silver to take its direction from gold over the next 12 months.
BMO Capital Markets warned in January, near the ratio’s low, that the ratio’s fall might not last. Its analysts argued that since the 1970s, periods of large physical surplus in silver have pushed the ratio higher, and they expect its long-term trajectory “to be firmly upward.”
Others read the same number the other way. Many dealers treat a high ratio as a buying signal for silver; USAGOLD’s guide to the ratio, for example, says that above 80, “Silver appears cheap compared to gold.” Both camps are describing the same number. What it means depends on the time frame you use.
| Price | 1 month | This year | 1 year | 5 years | |
|---|---|---|---|---|---|
| Gold | $3,891.13 /oz | −6.9% | −10.1% | −7.2% | +108.5% |
| Silver | $48.84 /oz | −17.4% | −30.8% | −8.0% | +94.5% |
| Bitcoin | $65,055 | −20.8% | −26.7% | −31.9% | +2.4% |
What to watch
- Interest rates: the Fed’s December 9 decision. Higher rates have weighed on both metals this year, and more heavily on silver.
- Industrial demand: especially solar, where manufacturers are using less silver per panel.
- Investor flows: silver coins, bars and funds, where Metals Focus sees little new conviction.
- The Silver Institute’s interim review, usually published in mid-November, for any change to its 2026 deficit forecast.
Silver now trades at Silver per ounce: $48.84 (+0.27% today) Live silver price →. For the full daily record since 1968, see Corgano’s gold-silver ratio history.
Sources
- Corgano market-history database: daily gold and silver prices since 1968; ratio highs, lows, averages and 12-month changes calculated by Corgano
- Kitco, This week’s sell-off in gold brought November into the red (November 13, 2026)
- Congressional Research Service, Brief history of the gold standard in the United States
- Coinage Act of 1834; Encyclopedia.com, Bimetallism; APMEX, What is bimetallism? (the free silver movement)
- US Geological Survey, Mineral Commodity Summaries 2026: silver; Farmonaut, gold and silver mine output, 2025 (USGS estimates)
- Silver mined in history (about 1.8 million tonnes) and gold (224,200 tonnes, World Gold Council): Corgano’s silver and gold mining pages
- The Silver Institute, World Silver Survey 2026 and mine output by country, via Statista and MINING.COM
- World Gold Council, Gold Demand Trends Q3 2026: central banks; MiningVisuals, gold mine production 2025
- Silver Thursday (1980); Silver as an investment (2011 peak); Gulf War; 2020 stock market crash; Liberation Day tariffs
- Kitco, Silver could see further losses against gold as physical market weakens – Metals Focus (October 29, 2026); FXStreet, The gold-silver ratio is expanding: what next?
- USAGOLD, Gold-silver ratio guide
- Kitco, BMO warns investors that the gold/silver ratio could be nearing a historic bottom (January 15, 2026)
- Live prices, ratio and comparison: Corgano Silver Price and Corgano Gold Price
This article is for general information only. It is not investment, financial, tax or legal advice, and it is not a recommendation or an offer to buy or sell gold, silver, bitcoin or any other asset or security. Prices and figures can be delayed, change quickly and may contain errors. Forecasts and opinions quoted are those of the people and organizations named, not ours, and are not guarantees of future results. Investing involves risk, including the loss of the money you invest, and past performance does not predict future returns. Do your own research and consider speaking with a licensed financial adviser before making any financial decision.