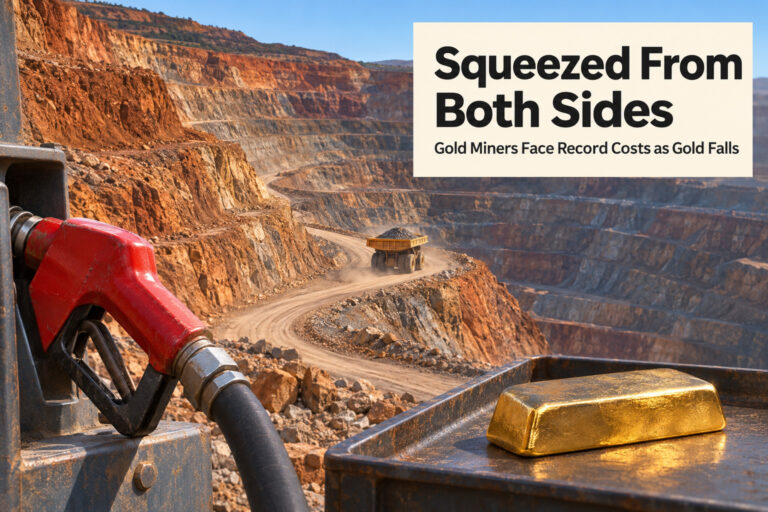
At the start of 2026, gold miners were making more money per ounce than ever. Since then, they’ve been squeezed from both sides. The Iran war pushed up the price of the diesel that runs their trucks and mills, and gold has fallen by more than a quarter from its January record, partly because of the war’s effect on interest rates. Mining costs are now at a record. Here’s how much margin is left, and why it matters for mining shares.
From record margins to a squeeze
In the first quarter of 2026, the industry’s average all-in sustaining cost (AISC) was $1,785 an ounce, and with gold averaging close to $4,900, the average AISC margin reached a record $3,076 an ounce, according to World Gold Council data. AISC is the industry’s standard measure of what it costs to keep a mine running, including sustaining investment, royalties and overheads.
The second quarter turned that around. Average AISC rose 8% on the quarter and 22% on the year to a record $1,930 an ounce, while the average gold price fell 7.2% to $4,512. Margins shrank by 16% to $2,582 an ounce, though they were still 52% higher than a year earlier.
Third-quarter results, reported in the past few weeks, show costs still rising:
- Agnico Eagle reported AISC of $1,648 an ounce, up from $1,331 a year earlier, and blamed diesel and tariffs. Diesel alone added more than $30 an ounce to cash costs against its budget.
- Pan American Silver’s gold mines reported AISC of $2,281 an ounce, up $584 on the year, and the company raised its full-year gold cost guidance to $2,000–$2,150 from $1,700–$1,850.
- Newmont, the largest gold miner, bucked the trend with AISC of $1,454 an ounce, and lowered its full-year guidance to $1,520.
Where margins stand now
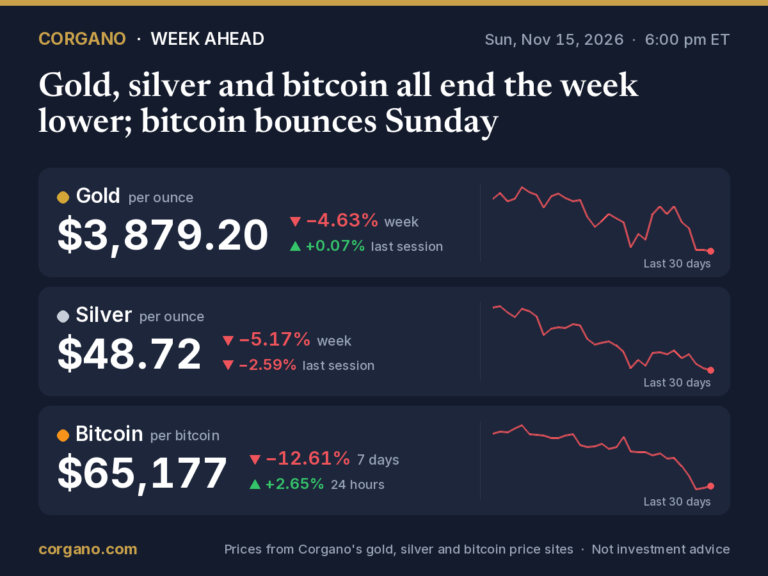
Gold now trades at Gold per ounce: $3,891.13 (+0.28% today) Live gold price →, after closing just under $3,900 on November 13. Using the World Gold Council’s latest industry cost figure of $1,930, an average mine would earn roughly $1,970 an ounce above its all-in sustaining cost at that price, by Corgano’s calculation. That’s about a third less than the first-quarter record, but still somewhat above the margin of mid-2025. Costs have probably kept rising since the second quarter, so the real figure is likely lower.
Why diesel matters so much
Gold mining is an energy business. Energy typically makes up about 20% of a mine’s operating costs, and gold miners use refined fuels, mainly diesel, rather than crude oil. That has made this year’s shock worse than the oil price alone suggests. US diesel refining margins hit records this autumn: the Gulf Coast diesel crack spread peaked at $115.78 a barrel in September, according to EIA data, and the US average price of diesel at the pump reached a record $6.52 a gallon on September 22, according to AAA.
Not every mine is equally exposed:
- Open-pit mines, which use large diesel truck fleets, are hit hardest. “Open-pit miners are essentially long on gold but short on oil,” analysts at Jefferies wrote.
- Underground mines on the electricity grid are far less exposed. For them, diesel may be just 4–5% of total costs, according to Olive Resource Capital.
- Hedged miners have some protection for now. Miners with diesel hedges or regulated energy prices are better insulated in the near term, Jefferies said.
There’s also a delay. Vertium Asset Management’s Jason Teh warned that quarterly cost figures can reflect energy prices from months earlier, which can give investors a false sense of security.
It’s not only fuel
Diesel is the headline, but other costs are rising too. In the second quarter, higher sustaining capital spending, the money needed to keep existing mines going, accounted for about 80% of the rise in industry AISC, lifting its share of the cost base to 23% from 18%. Royalties and production taxes rise automatically with the gold price. Labour costs are up. And some mines are producing less: Pan American blamed lower output at several gold mines for its higher costs, because fixed costs are spread over fewer ounces.
Even so, the industry is producing more gold than ever. Mine output rose 3% in the third quarter to 1,071 tonnes, a record for the period, and the World Gold Council expects a record for 2026 as a whole. Its analysts noted that “gold miners have faced pressures from higher energy and consumable prices over the past year, while sustaining capex cost has also increased rapidly.”
Why mining shares fall faster than gold
Mining shares magnify moves in the gold price, in both directions. That’s because most costs stay the same when gold moves. On the way up it worked spectacularly: in 2025 the main gold-miner index rose about 155% while gold rose about 64%.
On the way down, the same arithmetic works against them. Take the second quarter’s figures: if gold fell 10% from $4,512, the average margin would fall from $2,582 to about $2,130, a drop of about 17.5%, by Corgano’s calculation. “Most costs don’t fall when gold falls, so each percent lost in the gold price takes a bigger percentage out of the margin,” analyst Przemyslaw Radomski wrote in October.
That showed up in the shares this year. The VanEck Gold Miners ETF (GDX) fell about 10% in the first two trading days after the war began, and about 17% between February 27 and May 6. In late October, Newmont reported record third-quarter adjusted net income, yet its shares fell 4.6% the next day, more than twice as much as the GDX. The market “looked past the record and at the fourth quarter,” Radomski wrote.
Silver miners: a different story
Silver producers look quite different, because most silver is mined as a by-product of lead, zinc, copper and gold mines. Their silver costs are reported net of the money they make from those other metals, so higher prices for zinc and copper bring silver costs down.
Pan American Silver shows the split clearly. Its silver mines reported AISC of just $11.21 an ounce in the third quarter, down from $15.43 a year earlier, helped by its new Juanicipio mine and higher zinc and copper prices. Its gold mines went the other way, to $2,281. Silver now trades at Silver per ounce: $48.84 (+0.27% today) Live silver price →, still far above that cost. Pan American’s own outlook assumes $60 silver for the fourth quarter, though, which is well above today’s price.
What to watch
- Diesel prices. Energy Secretary Chris Wright has said diesel prices peaked in September. Doomberg, the energy newsletter, expects diesel refining margins to “come in quite aggressively” within a year if there’s no major escalation. That would help open-pit miners most.
- The gold price. At $3,900, average margins are still wide. The question is how far gold falls and for how long.
- Fourth-quarter results and 2027 guidance, due early next year, when companies will show how much of the diesel spike has fed into costs.
- Hedging. Producers have been cutting their gold hedges for 11 straight quarters, which leaves them more exposed to the gold price either way.
For more on where gold comes from, see Corgano’s pages on the world’s largest gold mines and gold production by country.
Sources
- Bullion Trading LLC, Cost to mine an ounce of gold; Farmonaut, WGC AISC data, Q1 2026
- World Gold Council, Gold miners remain resilient despite tighter margins in Q2’26 (November 2026)
- World Gold Council, Gold Demand Trends Q3 2026: supply
- Agnico Eagle, Third quarter 2026 results; Investing.com, Agnico Eagle Q3 2026 slides
- TIKR via Yahoo Finance, Agnico Eagle soars 10% (Newmont AISC)
- Pan American Silver, Q3 2026 MD&A and results release; Earnings Whispers via Finviz
- Vertium Asset Management, The gold–oil ratio in reverse (Livewire)
- Skillings, Jefferies on open-pit miners; The Northern Miner, Open-pit gold miners most exposed to inflation: Jefferies
- Crux Investor, Gold miners’ record Q1 2026 profits face Q2 squeeze (Olive Resource Capital)
- Energy News Beat, The Atlantic Distillate Trap (EIA diesel crack data); Transport Topics, AAA diesel prices
- Incrementum, In Gold We Trust: gold and silver miners (2025 performance)
- Przemyslaw Radomski, Why gold miners fall even after record profits (Kitco) and FXStreet
- Benzinga via Webull, Gold miners are the biggest losers of the Iran war and The Hormuz reopening trade
- US Geological Survey, Mineral Commodity Summaries 2026: silver
- The David Lin Report, interview with Doomberg (clip of Chris Wright)
- Kitco, gold price, November 13, 2026
This article is for general information only. It is not investment, financial, tax or legal advice, and it is not a recommendation or an offer to buy or sell gold, silver, bitcoin or any other asset or security. Prices and figures can be delayed, change quickly and may contain errors. Forecasts and opinions quoted are those of the people and organizations named, not ours, and are not guarantees of future results. Investing involves risk, including the loss of the money you invest, and past performance does not predict future returns. Do your own research and consider speaking with a licensed financial adviser before making any financial decision.