Gold has had a brutal year. It’s now more than a quarter below the record it set in January. It has fallen this far from a record five times since its price was set free in 1968. Two of those falls were over within about a year. The other three went much deeper and lasted years, and in one case decades. Here’s what happened each time, and what’s different now.
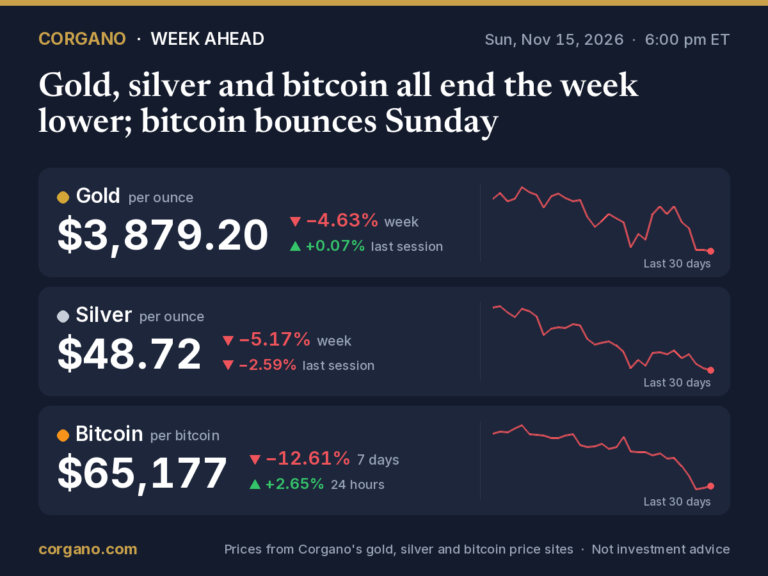
Gold trades at Gold per ounce: $3,891.13 (+0.28% today) Live gold price →. Its highest daily close on record is Gold's highest daily close on record: $5,318.40 per ounce, on 29 January 2026. (Daily closes since 2000.) Gold price history →, set on January 29, 2026. It traded even higher during that day, near $5,600, before falling sharply the next day when President Trump named Kevin Warsh as his choice to lead the Federal Reserve. By Friday, November 13, gold futures had closed just under $3,900, about 27% below the record close and about 30% below the intraday high.
Five falls since 1968
Corgano’s price database goes back to 1968, when gold first traded freely in London. Measured by daily closing prices, gold has fallen nearly 30% or more from a record high five times:
| Record close | Lowest close | Fall | Time to the low | Back to a new record |
|---|---|---|---|---|
| $127.00, July 6, 1973 | $90.00, November 14, 1973 | 29% | 4 months | January 1974, after 6 months |
| $195.25, December 30, 1974 | $103.50, August 25, 1976 | 47% | 20 months | July 1978, after 3½ years |
| $850.00, January 21, 1980 | $252.80, July 20, 1999 | 70% | 19½ years | January 2008, after 28 years |
| $1,011.25, March 17, 2008 | $712.50, October 24, 2008 | 30% | 7 months | September 2009, after 1½ years |
| $1,895.00, September 5, 2011 | $1,050.30, December 17, 2015 | 45% | 4¼ years | July 2020, after almost 9 years |
| $5,318.40, January 29, 2026 | about $3,900 so far (November 2026) | about 27% so far | 9½ months so far | – |
London afternoon fix to September 2017, COMEX futures closes after that. Intraday highs and lows were further apart.
The five falls followed three quite different paths.
Path one: a sharp drop, then a quick recovery
1973. Gold had roughly tripled since August 1971, when the US stopped exchanging dollars for gold. In November 1973, central banks ended the “two-tier” system that had kept official gold off the private market, leaving them free to sell. Gold briefly fell below $90. The fear didn’t last. The Arab oil embargo that autumn set off a wave of inflation, and by January 1974 gold was at a new record.
2008. Gold topped $1,000 for the first time in March 2008, then fell as the financial crisis forced investors to sell whatever they could to raise cash. It bottomed in late October, weeks after the collapse of Lehman Brothers. The recovery came from the Fed. In November 2008 it announced its first large bond purchases, and in December it cut its main interest rate to between 0 and 0.25%. Gold was at a new record by September 2009.
Both falls stopped close to 30%. In both cases, something soon came along that lifted gold: an inflation shock in 1973, and near-zero interest rates in 2008.
Path two: a long grind lower
1974–76. Gold peaked on December 30, 1974, the day before Americans were allowed to own gold again for the first time since 1933. The expected rush of buyers never came. Instead, the US Treasury auctioned 2 million ounces in January 1975, and the International Monetary Fund began selling part of its gold in June 1976. Meanwhile US inflation eased, from 12.3% at the end of 1974 to 5.7% by August 1976. Gold nearly halved, and only recovered when inflation picked up again later in the decade.
2011–15. Gold set a record in September 2011, a month after Standard & Poor’s cut the US credit rating. Then the selling started. On April 15, 2013, gold fell 9%, its biggest one-day drop in more than 30 years. That June, Fed Chairman Ben Bernanke said the Fed could begin “tapering” its bond purchases. Investors pulled 881 tonnes of gold out of exchange-traded funds in 2013, according to the World Gold Council. Gold hit its low on December 17, 2015, the day after the Fed raised rates for the first time since the financial crisis. It took the pandemic, and a return to zero interest rates in March 2020, to push gold to a new record that July.
In both cases, big holders were selling: the US Treasury and the IMF in the 1970s, and ETF investors in 2013. And in both, the fear that had driven gold up was fading, whether of inflation in the 1970s or of financial crisis in 2013.
On 17 December 2015, gold closed at $1,050.80 per ounce. Today's price is 270% higher. Gold prices in December 2015 →Path three: a lost generation
1980–99. The worst fall began at the top of the great 1970s inflation. Gold hit $850 at the London fix on January 21, 1980, weeks after the Soviet invasion of Afghanistan. Fed Chairman Paul Volcker had already changed course in October 1979 to fight inflation, and rates went much higher. By December 1980, the US prime rate reached a record 21.5%. With interest rates far above inflation, holding gold meant giving up a large income, and gold slid for most of the next two decades.
Central banks added to the pressure in the 1990s. In May 1999, Britain announced it would sell more than half its gold reserves at auction. Gold hit its low that July, and only stabilized after European central banks agreed that September to cap their sales at 400 tonnes a year. Gold didn’t get back above $850 until January 2008, 28 years later. After inflation, it took even longer. By Corgano’s calculation using US consumer prices, gold first passed its 1980 record in today’s money on September 2, 2025, more than 45 years later.
On 21 January 1980, gold closed at $850.00 per ounce. Today's price is 358% higher. Gold price history since 1968 →What separated the quick recoveries from the slow ones
Two things stand out across the five falls:
- Interest rates and inflation. The quick recoveries came when rates fell or inflation surged. The long falls came when interest rates were rising or inflation was easing: falling inflation in 1975–76, Volcker’s tightening after 1979, and the end of zero rates after 2013.
- Big sellers. The long falls came with heavy selling by large holders: governments and the IMF in the 1970s, central banks in the 1990s, and ETF investors in 2013.
How 2026 compares
This year looks like the long falls on the first point and the quick recoveries on the second.
Rates are rising. The Fed raised rates in September 2026 for the first time since 2023, and markets expect another increase in December. The cause is unusual: an oil shock from the Iran war, not an overheating economy. Morgan Stanley’s Amy Gower said earlier this year that “gold’s sensitivity to monetary policy has taken over as the key price driver.”
The big holders are buying. Central banks bought 321 tonnes in the third quarter, the most since late 2024, and 675 tonnes in the first nine months, 6% more than a year earlier, according to the World Gold Council. That’s the opposite of the 1990s, when they were sellers. Gold ETFs also took in 211 tonnes in the third quarter, raising their holdings to a record 4,256 tonnes. That’s very different from 2013, though ETF investors did sell in October.
Forecasters are split on how this plays out. Goldman Sachs cut its target for the end of 2026 to $4,150 an ounce and for the end of 2027 to $4,800. It still expects steady central bank buying, but warned that a more hawkish Fed could leave gold near $4,660 at the end of 2027. In May, ING said gold’s path higher depended on energy prices easing, inflation cooling and the Fed cutting rates.
What history can and can’t tell you
Five falls is a small sample, and each came under a different monetary system. Some came under fixed exchange rates and some after them; some at a time of central bank selling and some of central bank buying. History shows that a 27% fall has sometimes been the end of a correction and sometimes the start of a much longer one. It doesn’t say which this is.
For the full record, see Corgano’s inflation-adjusted gold price and the year pages for 1980, 2008, 2011 and 2015.
Sources
- Corgano market-history database: daily gold prices since 1968 (London PM fix, COMEX closes from September 2017) and US CPI
- Kitco, This week’s sell-off in gold brought November into the red (November 13, 2026)
- World Gold Council, Historic gold agreements; Encyclopaedia Britannica, Two-tier gold system
- The Spectator archive, The gold future (December 1, 1973)
- BullionStar, COMEX gold futures (December 31, 1974)
- US Office of the Historian, US Treasury gold auction, January 1975
- IMF, IMF chronology (1976 gold auctions)
- Federal Reserve History, Volcker’s announcement of anti-inflation measures (October 1979)
- FedPrimeRate.com, Prime rate history
- National Audit Office, The sale of part of the UK gold reserves
- Washington Agreement on Gold (September 1999)
- History of FOMC actions (November–December 2008)
- Christian Science Monitor, Gold price: biggest tumble in 30 years (April 15, 2013)
- CNN Money, Funds dumped $40 billion in gold in 2013 (World Gold Council data)
- Federal Reserve, FOMC statements of December 16, 2015 and March 15, 2020
- Hvylya, The Warsh effect (January 30, 2026)
- Herald Corp, Fed’s September 2026 hike
- Morgan Stanley, Gold’s safe-haven status faces a reality check
- World Gold Council, Gold Demand Trends Q3 2026: central banks; Money Metals, Q3 ETF flows
- Investing Live, Goldman cuts gold forecasts; ROIC.ai, Goldman’s hawkish scenario
- ING Think, Why gold isn’t acting like a safe haven right now (May 2026)
This article is for general information only. It is not investment, financial, tax or legal advice, and it is not a recommendation or an offer to buy or sell gold, silver, bitcoin or any other asset or security. Prices and figures can be delayed, change quickly and may contain errors. Forecasts and opinions quoted are those of the people and organizations named, not ours, and are not guarantees of future results. Investing involves risk, including the loss of the money you invest, and past performance does not predict future returns. Do your own research and consider speaking with a licensed financial adviser before making any financial decision.