For more than a decade, bitcoin has moved in a rough four-year rhythm tied to its “halving,” the scheduled cut in new supply. Each of its past bear markets bottomed about a year after the peak. This one is now 405 days old. By the old clock, the low would be due about now. But this cycle has already broken the pattern in other ways, and the experts are split on whether the clock still works.
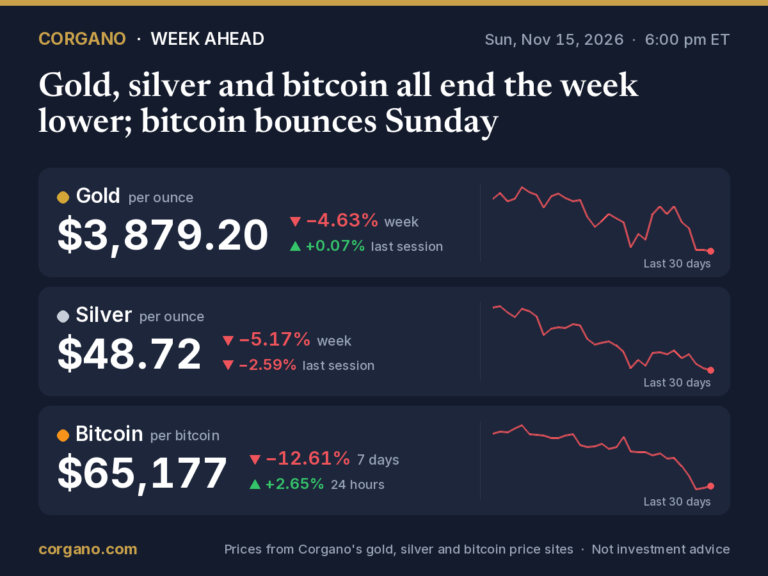
Bitcoin trades at 1 BTC: $64,958 (+2.46% 24h) Live bitcoin price →. Its highest daily close on record is Bitcoin's highest daily close on record: $124,753 per bitcoin, on 6 October 2025. (Daily closes since 2014.) Bitcoin price history →, set on October 6, 2025. On Sunday it was about 48% below that record, after a weekend sell-off took it close to $62,000.
How the four-year cycle works
Every 210,000 blocks, about every four years, the number of new bitcoin paid to miners is cut in half. In each of the three past cycles, the price rose to a peak in the year and a half after a halving, then fell by around 80% over roughly a year, then slowly recovered before the next halving.
| Halving | Cycle peak (daily close) | Days after halving | Peak × halving-day price | Fall after the peak | Days from peak to low |
|---|---|---|---|---|---|
| November 28, 2012 | $1,132, December 4, 2013 | 371 | 92.6× | −84%, to $178 (January 14, 2015) | 406 |
| July 9, 2016 | $19,497, December 16, 2017 | 525 | 30.0× | −83%, to $3,237 (December 15, 2018) | 364 |
| May 11, 2020 | $67,567, November 8, 2021 | 546 | 7.85× | −77%, to $15,787 (November 21, 2022) | 378 |
| April 20, 2024 | $124,753, October 6, 2025 | 534 | 1.92× | −53% so far (June 30, 2026) | 405 days so far |
Daily closes in US dollars, from Corgano’s halving-cycles and drawdown pages. 2012 cycle: Bitstamp prices; from September 2014: BTC-USD at 00:00 UTC.
What this cycle got right
The timing of the top matched the pattern closely. Bitcoin’s record close came 534 days after the April 2024 halving, between the 525 and 546 days of the two cycles before. Analyst Benjamin Cowen put it this way: “Bitcoin topped within one week of when it historically tops, despite the narratives for calling the four-year cycle dead.”
The timing of the low is the next test. Past bear markets bottomed 364 to 406 days after the peak. Counted from October 6, 2025, that window ran from early October to mid-November 2026, which is now. Cowen and veteran chartist Peter Brandt both pointed to October 2026 for a bottom, Brandt on the grounds that past bear markets ended 12 to 18 months before the next halving. Corgano’s halving tracker puts the next halving in about February 2028, at the recent pace of blocks.
What this cycle got wrong
Almost everything else has been smaller.
- A smaller boom. Each cycle’s peak has been a smaller multiple of its halving-day price: 92.6 times in the 2012 cycle, 30 times in 2016, 7.85 times in 2020, and just 1.92 times this time.
- A shallower fall, so far. Past bear markets took bitcoin 77% to 84% below its peak. This one’s deepest close, on June 30, was about 53% below the record.
- A weaker post-halving year. By one count, from the crypto exchange Bex, this was the first cycle in which the year after the halving finished lower.
That’s why many people now argue the old rhythm has faded. The halving matters less each time: the 2024 halving cut new supply from 900 to 450 bitcoin a day, a small number next to the money that now moves through US spot bitcoin ETFs. In one analysis cited by crypto.news, ETFs now shift more capital in a month than miners produce in a year.
Three views of the cycle
The cycle is alive. Cowen dismisses the idea that ETFs, corporate buyers or a government bitcoin reserve have broken the pattern, arguing that every past cycle produced similar stories before the bear market came anyway. He expected bitcoin to revisit $60,000, and his base case for the cyclical low was October 2026.
The cycle is dead. Strategy’s Michael Saylor declared the four-year cycle “dead” in April. The trading firm Wintermute said the same: “The four-year cycle is dead.” In this view bitcoin now moves with interest rates, liquidity and fund flows, not with the halving calendar.
The cycle has changed shape. K33 Research takes a middle path. Its head of research, Vetle Lunde, argued in May that “the less aggressive bull market of 2025 sets the stage for a more moderate bear market in 2026,” with the February low near $60,000 as the likely maximum drawdown. Bitcoin went slightly lower in June. “No major bear market has ended without BTC touching its 200-week moving average, and this cycle was no exception,” Lunde said in a later note. K33’s mid-year review added: “While the historical four-year cycle suggests further downside remains possible, we expect this cycle’s maximum drawdown to be materially less severe than in previous cycles.”
What’s pushing bitcoin now
Whatever the cycle says, the pressure in recent weeks has come from familiar places:
- US spot bitcoin ETFs lost $2.35 billion in the two weeks to November 13.
- Hot US inflation figures have markets expecting another Fed rate hike in December.
- Forced selling of leveraged bets added about $6 billion of crypto liquidations in a week.
Ether has had a similar run: spot ether ETFs have seen seven straight weeks of outflows, and ether fell to just above $1,700 on Saturday, a three-month low.
What the cycle data can and can’t tell you
Four halvings is a very small sample. The pattern has held on timing so far, but the size of each move has shrunk every cycle, and the market now includes ETFs, public companies and large institutions that weren’t there in 2015 or 2018. If the clock still works, a low should form around now. If it doesn’t, the calendar may matter less than the Fed and the fund flows. Either way, Corgano’s own halving page puts it plainly: “With only 4 halvings, these are patterns in a handful of cases, not rules.”
Follow the numbers on Corgano’s halving cycles, drawdown and halving countdown pages.
Sources
- Corgano Bitcoin Price, Bitcoin halving cycles compared and Bitcoin drawdown from all-time high (daily closes to November 15, 2026)
- BeInCrypto, Bitcoin four-year cycle not dead, Benjamin Cowen says
- Crypto.news via Investing.com, Is the bitcoin halving cycle dead? (May 2026; Peter Brandt, ETF flows)
- Crypto.news, Michael Saylor declares the four-year cycle “dead” (April 5, 2026)
- Bex, Is bitcoin’s four-year cycle dead? (Wintermute; 2024 halving issuance)
- The Block, K33 argues February’s $60K low still marks cycle’s maximum drawdown (May 20, 2026)
- The Block, More than 50% of bitcoin supply is underwater: K33
- K33 Research, H1 2026 round-up
- BIT Research, Is the bear market nearing its end? (June 30 low)
- Traders Union, Crypto market suffers historic 10-day selloff; CryptoPotato, ETF flows, November 9–13; Aktualita, Bitcoin rebounds above $65,000 (November 15, 2026)
- Kitco, December Fed rate-hike pricing (November 13, 2026)
This article is for general information only. It is not investment, financial, tax or legal advice, and it is not a recommendation or an offer to buy or sell gold, silver, bitcoin or any other asset or security. Prices and figures can be delayed, change quickly and may contain errors. Forecasts and opinions quoted are those of the people and organizations named, not ours, and are not guarantees of future results. Investing involves risk, including the loss of the money you invest, and past performance does not predict future returns. Do your own research and consider speaking with a licensed financial adviser before making any financial decision.