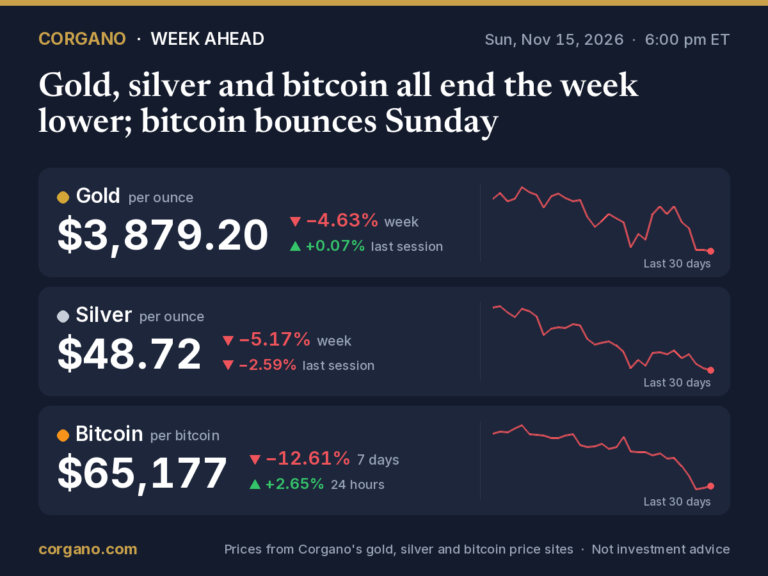
Bitcoin fell close to $62,000 on Sunday before climbing back above $65,000. It has been one of the sharpest 10-day declines in the crypto market’s history, driven by steady selling from US exchange-traded funds, forced liquidations of leveraged bets and expectations of another Fed rate hike.
Bitcoin now trades at 1 BTC: $64,958 (+2.46% 24h) Live bitcoin price →. On Sunday, November 15, it traded around $65,400 after swinging between about $61,956 and $67,150 over 24 hours, according to CoinGlass data reported by Aktualita. It was still down more than 12% over seven days.
The fall has been fast. Ten days ago bitcoin was near $81,000, CryptoPotato noted. It’s now roughly 48% below its record of about $126,198, set in October 2025. Its highest daily close on record is Bitcoin's highest daily close on record: $124,753 per bitcoin, on 6 October 2025. (Daily closes since 2014.) Bitcoin price history →.
The wider market has fallen with it. Between November 4 and 14, the total value of all crypto assets dropped by about $571 billion, from $2.69 trillion to $2.12 trillion, a 21.2% fall. Traders Union counted only four 10-day periods with bigger losses: May 2021, October and November 2025, and February 2026.
ETF investors keep selling
The steadiest pressure has come from the US spot bitcoin ETFs, the funds that let investors hold bitcoin through an ordinary brokerage account. They lost $1.07 billion in net withdrawals in the week of November 9 to 13, according to SoSoValue data. That was the second week in a row with outflows above $1 billion, and brought the two-week total to $2.35 billion.
The selling came every day of the week:
- Monday, November 9: about $201 million out
- Tuesday: $95 million
- Wednesday: $300 million
- Thursday: $284 million
- Friday: $185.45 million, including about $143.5 million from BlackRock’s iShares Bitcoin Trust (IBIT)
Friday was the seventh losing session in a row, with close to $1.9 billion withdrawn over that run. Only one of November’s first 10 trading days saw net inflows. Cumulative net inflows into the funds since their launch have fallen from $57 billion on October 30 to $54.63 billion.
Leverage made the fall worse
Forced selling added to the drop. When prices fall sharply, exchanges close out traders who borrowed to bet on a rise, and those sales push prices lower again. CoinGlass recorded about $808 million of bitcoin futures liquidations in the 24 hours to Sunday, roughly three-quarters of them long positions. Across the whole crypto market, liquidations totalled about $6 billion over seven days, including $2.02 billion in the latest 24 hours.
Technical selling played a part too. “Bitcoin broke down through its 200-day moving average of about $73,000,” Rich Rosenblum, co-founder of the market maker GSR, said in comments reported by Aktualita. Many traders watch that average to judge the longer-term trend. Bitcoin had only climbed back above it in August, after 270 days below. On November 11 it slipped under again, after the October US inflation figures came in hotter than expected.
Large holders are feeling it. Bitcoin is now below the $75,451 average price that Strategy, the biggest corporate holder, paid for its 849,327 bitcoin.
Ethereum is under the same pressure
Spot ether ETFs lost about $398.9 million between November 9 and 13. They have now had seven straight weeks of outflows, one short of their record. Cumulative net inflows into those funds have fallen from $13.94 billion at the end of September to $11.52 billion. Ether dipped just above $1,700 on Saturday, its lowest in three months.
Why it’s happening
Crypto has been caught in the same pressures as other risky assets. Inflation is running hot, and markets expect the Federal Reserve to raise rates again at its December 8–9 meeting. Higher rates make cash and bonds more attractive against assets that pay no income, such as bitcoin.
Weakness in technology stocks has spilled over as well. Traders Union reported that Tom Lee, chairman of BitMine, pointed to margin calls from the sell-off in Nvidia shares and to investors selling assets ahead of Anthropic’s IPO. Other strains it listed include tighter US curbs on chip exports to China and tension in the Middle East.
Traders Union noted that the liquidations are clearing out excess leverage, which could leave a healthier base over time. For now, though, ETF flows still point to weak demand from institutions.
What to watch
- ETF flows when US markets reopen on Monday, November 16. An end to the outflow streak would be the clearest sign that institutional selling is easing.
- Price levels traders are watching: Sunday’s low near $62,000 and the round $60,000 below it, and on the upside the $67,000 top of the latest range and then $70,000, Aktualita noted.
- The Fed’s December 9 decision, and the inflation data before it.
- Leverage: whether open interest and liquidations keep falling, which would mean forced selling is fading.
Sources
- Aktualita, Bitcoin rebounds above $65,000 after steep weekend selloff (November 15, 2026; CoinGlass data, ETF flows, Rich Rosenblum quote)
- Traders Union, Crypto market suffers historic 10-day selloff as ETF outflows and liquidations deepen (SoSoValue and CoinGlass data, Tom Lee)
- CryptoPotato, Almost $1.5 billion withdrawn from bitcoin and Ethereum ETFs in a single week (daily ETF flows)
- Crypto Briefing, Bitcoin reclaims 200-day moving average after 270 days below it
- CryptoTicker, Bitcoin price at $73,700: outflows from BlackRock’s IBIT (November 11, 2026)
- CryptoTicker, Bitcoin slips below Strategy’s $75,451 cost basis (November 9, 2026)
- Kitco, December Fed meeting and rate-hike pricing (November 13, 2026)
- Live price, chart and record close: Corgano Bitcoin Price
This article is for general information only. It is not investment, financial, tax or legal advice, and it is not a recommendation or an offer to buy or sell gold, silver, bitcoin or any other asset or security. Prices and figures can be delayed, change quickly and may contain errors. Forecasts and opinions quoted are those of the people and organizations named, not ours, and are not guarantees of future results. Investing involves risk, including the loss of the money you invest, and past performance does not predict future returns. Do your own research and consider speaking with a licensed financial adviser before making any financial decision.