War and inflation are supposed to be good for gold and silver. This year both metals are falling instead. Analysts say that’s not because the safe-haven idea has died, but because this crisis runs through oil, inflation and interest rates.
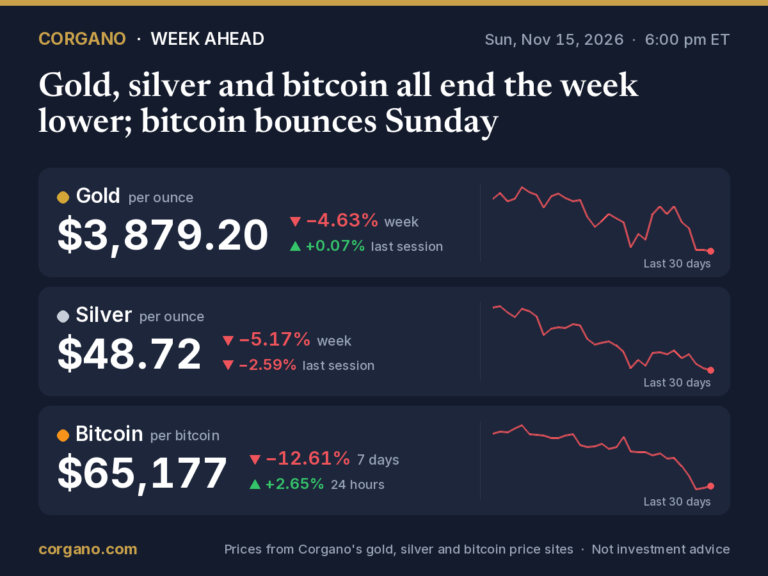
Gold now trades at Gold per ounce: $3,890.59 (+0.26% today) Live gold price →. On Thursday, November 12, it fell as low as $3,852 an ounce, its lowest in 13 months, and it ended the week just under $3,900. That’s about 30% below the record of roughly $5,595 it set on January 29. Its highest daily close on record is Gold's highest daily close on record: $5,318.40 per ounce, on 29 January 2026. (Daily closes since 2000.) Gold price history →.
Silver has fallen further. It settled at $48.48 an ounce on Friday, less than half its January record of about $121.60, and is now at Silver per ounce: $48.76 (+0.11% today) Live silver price →.
Most of the damage came in one week. On November 5 gold was trading above $4,130. Then a hot consumer price report on Tuesday revived fears of a Federal Reserve rate hike, and on Thursday the dollar reached a 19-month high. By Friday, Kitco noted, the selling had wiped out gold’s whole early-November recovery and left it down for the month.
Why the old playbook isn’t working
The usual pattern is simple: when the world gets more dangerous, money moves into gold. This year it hasn’t worked that way. Gold’s record came about a month before the US began strikes on Iran at the end of February. In March, gold fell more than 13%, its steepest monthly drop since October 2008.
Analysts trace this to oil. The war pushed oil prices up, and higher oil pushed inflation up. That led the Fed toward raising interest rates instead of cutting them. “With the conflict triggering an energy supply shock that has reduced hopes for lower US interest rates, it is not surprising that gold has struggled to work as a safe haven this time,” Amy Gower, a metals and mining commodity strategist at Morgan Stanley, said in the spring. ING made the same point. Higher oil prices, its analysts wrote, “push inflation up, keep central banks on hold and strengthen the dollar, all of which weigh on gold.” In their view the sell-off reflected the economic fallout of the war, “rather than a breakdown in gold’s safe-haven role.”
Interest rates matter because gold and silver pay no income. When Treasury bonds pay more, holding metal means giving up more interest. A stronger dollar adds to the pressure, because metals priced in dollars become more expensive for buyers using other currencies. Kitco summed it up in September: gold and silver “are trading as a rates-and-dollar market, not a clean safe-haven market.”
The link works in the other direction too. In the first week of November, as Brent crude fell about 13% to roughly $98 a barrel, gold posted its biggest weekly gain since August.
A week of inflation data
Three US reports in eight days pushed expectations of higher rates back up:
- Jobs, November 6: the October payrolls report strengthened bets on a December rate hike.
- Consumer prices, November 10: the CPI rose 0.4% in October, against a forecast of 0.3%. Core prices, which leave out food and energy, rose 0.3%, against 0.2% expected.
- Producer prices, November 13: the PPI rose 0.3% in October, a little below the 0.4% forecast. But producer prices were up 6.5% from a year earlier, the biggest annual rise since November 2022, and core producer prices were up 4.9%.
The softer monthly PPI number gave metals some relief on Friday. Kitco reported, though, that the persistent rise in underlying producer prices limited any shift in expectations for Fed policy.
What the Fed may do
The Fed raised rates in September and held its target range at 3.75%–4.00% in late October. After this week’s data, the CME FedWatch tool priced roughly a 90% chance of a quarter-point increase at the December 8–9 meeting, according to Kitco.
Goldman Sachs also expects a December hike, and doesn’t expect rate cuts until late 2027. In a scenario where the Fed hikes again in March 2027, the bank estimates gold would end 2027 near $4,660 an ounce.
What forecasters say
Views on gold range widely, and they’ve been coming down:
- Goldman Sachs cut its end-2026 target to $4,150 an ounce from $4,650 on November 5, and its end-2027 target to $4,800 from $5,400. It still expects central banks to buy about 60 tonnes a month.
- WisdomTree sees potential for $4,800 by 2027, Kitco reported on Friday.
- Jesse Colombo, an analyst, warned in a piece on Kitco that further dollar strength could take gold to $3,500.
- Société Générale estimated that index rebalancing after gold’s 13% decline could bring about $3.3 billion of buying.
- Kitco’s technical analysts put first support for gold at $3,852, Thursday’s low, and then at $3,823.
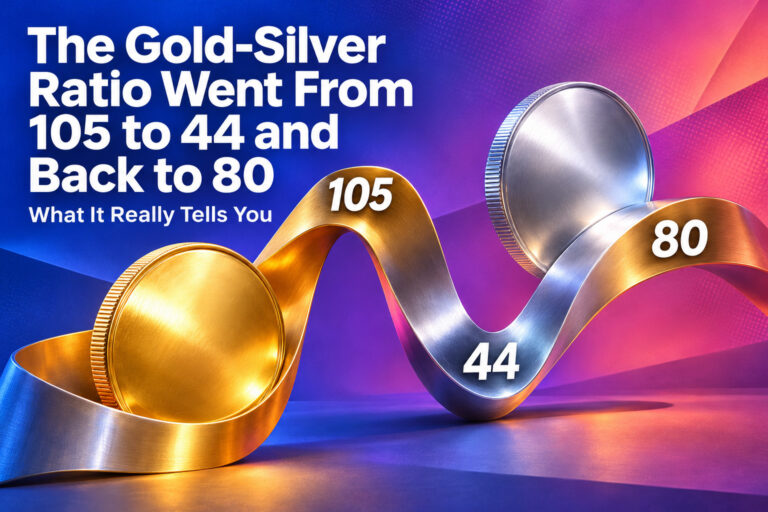
Silver is taking the bigger hit, as it often does when both metals fall. FXStreet calculated that silver was down 29.7% for the year before Friday’s data. Kitco put the gold-silver ratio, the number of ounces of silver that one ounce of gold buys, at about 80, up from about 74 in mid-October. Today it stands at Gold/silver ratio: 79.8 — one ounce of gold buys 79.8 ounces of silver. Gold/silver ratio since 1968 →.
What to watch
- the Fed’s decision on December 9;
- oil prices, and the talks over Iran and shipping through the Strait of Hormuz;
- the next US inflation reports;
- whether central banks keep buying gold at this year’s pace.
In May, ING said gold’s path higher depended on energy prices easing, inflation cooling and the Fed cutting rates. Six months later, none of those has happened yet. Until one of them does, gold and silver may keep following oil and rate expectations more closely than war headlines.
Sources
- Kitco, This week’s sell-off in gold brought November into the red (November 13, 2026)
- Kitco News, Gold prices testing resistance at $3,900 as producer prices continue to rise (November 13, 2026)
- Kitco NewsWire, Gold posts steep weekly loss as Treasury yields rise, Fed tightening bets persist (November 13, 2026)
- Kitco NewsWire, Gold, silver prices tumble as hot PPI lifts Fed-hike risk (September 10, 2026)
- Kitco, news headlines, November 13, 2026 (WisdomTree, Jesse Colombo, Goldman Sachs)
- FinanceFeeds, Gold price today: $3,888 on PPI day after a 13-month low (November 13, 2026; Société Générale estimate)
- FinanceFeeds, Silver price today near $50 as October PPI rises 0.3% (November 13, 2026)
- USAGOLD, daily report, November 13, 2026
- USAGOLD, daily report, November 10, 2026
- Investing Live, Goldman cuts gold forecasts to $4,150 for 2026, $4,800 for 2027
- ROIC.ai, Goldman Sachs cuts gold price targets on hawkish Fed shift (November 6, 2026)
- Morgan Stanley, Gold’s safe-haven status faces a reality check as prices fall
- ING Think, Why gold isn’t acting like a safe haven right now (May 2026)
- Trading Economics, gold news, March 31, 2026
- Money Metals, Gold and silver bounce back as tech stocks stumble (November 9, 2026)
- Bullion Trading LLC, weekly recap, November 2–6, 2026
- Crux Investor, silver’s January 29 record
- Live prices, record close and the gold-silver ratio: Corgano Gold Price and Corgano Silver Price
This article is for general information only. It is not investment, financial, tax or legal advice, and it is not a recommendation or an offer to buy or sell gold, silver, bitcoin or any other asset or security. Prices and figures can be delayed, change quickly and may contain errors. Forecasts and opinions quoted are those of the people and organizations named, not ours, and are not guarantees of future results. Investing involves risk, including the loss of the money you invest, and past performance does not predict future returns. Do your own research and consider speaking with a licensed financial adviser before making any financial decision.