Outsized reactions to the dollar and bond yields pushed gold under its October low.
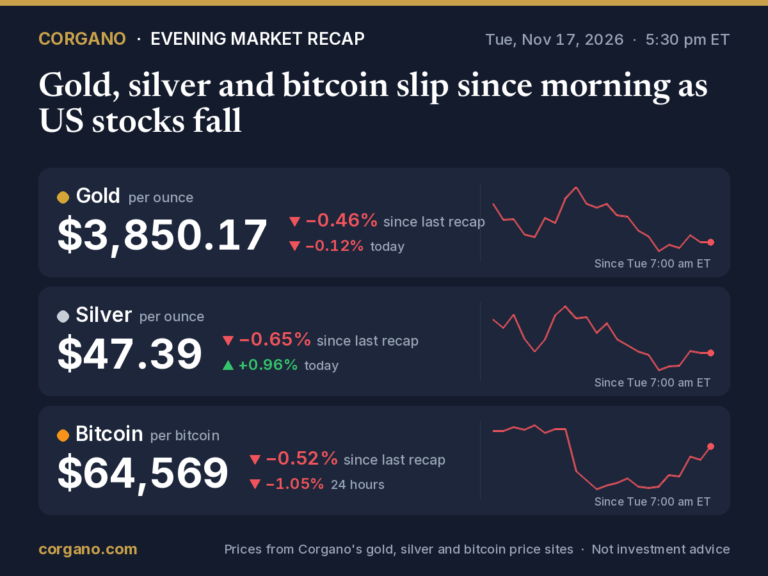
Gold went back and forth around $3,850 an ounce on November 17, unable to hold a rebound. FXEmpire’s Vladimir Zernov wrote that the metal failed to settle back above resistance at $3,890–$3,910 before sliding toward $3,850, just off its lowest levels of the year.
That price sits under $3,870.24, the October 31 low that StoneX analyst David Scutt named as a downside target only five days earlier. When Scutt wrote on November 12, gold had just dropped through $4,000 an ounce, a level he called psychologically important. The question he set out to answer still matters: why is gold falling so much harder than the forces pushing it?
A metal that overreacts to the dollar
Scutt’s answer is that gold has become unusually sensitive to the U.S. dollar. Using daily data back to 1976, StoneX measured gold’s beta to the U.S. Dollar Index over the past 252 trading sessions at -2.47. That reading ranks in the 99th percentile of the whole record. In plain terms, each 1% move in the index over the past year has come with a gold move of almost 2.5% the other way, on average.
Shorter windows are less extreme but still high. The 20-session beta is -1.70 and the 60-session figure is -1.90, around the 84th and 91st percentiles. Over 120 sessions the beta is -2.48, which is rare by historical standards.
The interesting part is where the extra sensitivity comes from. Scutt notes that, over those shorter periods, gold and the dollar haven’t moved in an unusually tight inverse pattern. What’s out of line is the size of gold’s swings. Across the past 252 sessions, gold’s volatility ran at about 5.42 times that of the dollar index. The historical median is 2.08 times.
He doesn’t claim to know the cause. His candidates are profit-taking after a long, multi-year rally, liquidation by investors who bought close to the record highs, or tighter liquidity across markets, which the recent slump in crypto and in some tech stocks would point to.
The rate shock
Bond yields have been the other trigger. On Tuesday, November 10, gold dropped 2.61% as the two-year Treasury yield climbed 18 basis points, its biggest one-day increase of 2026.
StoneX went back to August 2001 and found 44 earlier sessions in which the two-year yield rose by 18 basis points or more. On average, gold lost just 0.52% on those days. Only one of the 44 saw gold fall further than it did last week, which Scutt reads as a sign that the metal now responds sharply to yields as well as to the dollar.
This week: yields ease, stocks don’t
On November 17 that pressure eased a little. The two-year yield fell toward 4.78% and the 10-year settled under 5.10%, according to FXEmpire, as investors looked for safety while U.S. stocks dropped. Zernov points out that lower yields tend to help gold because the metal pays no interest. The dollar also eased against most major currencies as traders banked some gains, though the move was small and the currency remains near its highs for the year.
Stocks are the complication. FXEmpire says the equity sell-off has continued amid worries about AI, and that falling share prices can hurt precious metals because some traders have to sell their holdings to raise cash. That lines up with Scutt’s argument from last week: the struggles of other high-risk assets, he wrote, suggest liquidity is tightening across markets, which adds support for the dollar and, given gold’s current sensitivity, works against the metal.
The levels both analysts are watching
Scutt’s technical read on November 12 leaned bearish. Gold had stalled at $3,975.64, its RSI (14) was below the neutral 50 mark and making lower lows, and MACD had crossed into negative territory. He suggested short positions on a break under $3,975, aiming first for $3,920, then $3,900, and finally $3,870.24, the October 31 low. A lasting move back over $4,015, he added, would cast doubt on that bearish view.
Gold has since traded below every one of those targets, so FXEmpire’s map now starts lower. If $3,850 gives way, Zernov sees the next support in the $3,780–$3,800 range. On the way up, clearing $3,890–$3,910 would open the door to $4,000–$4,020, and a move past $4,020 would bring the 50 MA (moving average) at $4,133 into view.
Silver holds up better than platinum
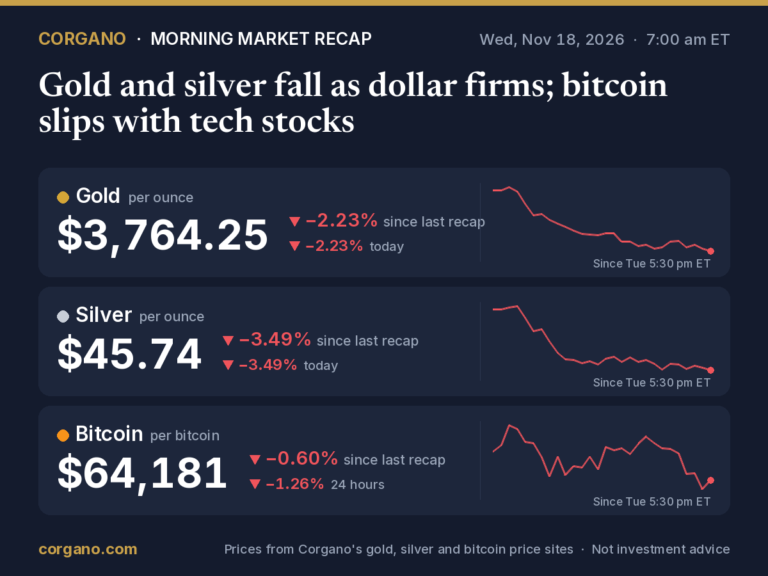
Silver had a firmer day, with dip buyers stepping in. The gold/silver ratio dropped under 81.50, which FXEmpire counts as positive for silver; if the ratio stays there, it could drift toward 80. Silver’s RSI has also climbed out of oversold territory. Zernov says silver would need to settle back above $47.00–$47.50 to aim for $51.00–$51.50, while a close below $47.00 would put $44.00–$44.50 in view.
Platinum is in worse shape. It broke through support at $1,440–$1,460 and fell toward $1,400, a slide FXEmpire links to the rebound in oil, which gained 1.6% as tensions in the Middle East grew. Under $1,400, the next support is $1,360–$1,380. A recovery above $1,460 would bring $1,520–$1,540 into play.
Sources
- FXEmpire: Gold (XAUUSD), Silver, Platinum Forecasts – Gold Attempts To Rebound As Dollar Pulls Back (2026-11-17)
- StoneX: Gold under the pump as dollar sensitivity surges (2026-11-12)
Disclaimer: This article is for general information only. It is not investment, financial, tax or legal advice, and it is not a recommendation or an offer to buy or sell gold, silver, bitcoin or any other asset or security. Prices and figures can be delayed, change quickly and may contain errors. Forecasts and opinions quoted are those of the people and organizations named, not ours, and are not guarantees of future results. Investing involves risk, including the loss of the money you invest, and past performance does not predict future returns. Do your own research and consider speaking with a licensed financial adviser before making any financial decision.