The Federal Reserve is expected to hold rates on Wednesday, inflation data follow on Thursday, and Americans vote in the midterm elections next Tuesday. Gold, silver, platinum and palladium are all testing support at the same time, so the next two weeks could decide whether the metals are bottoming or heading lower.
Key figures
- Gold, 1 troy ounce: $4,060.84, up 1.1% today after dipping to about $3,990
- Silver, 1 troy ounce: $54.45, up 0.9% today
- Platinum: $1,543.46; futures briefly fell below $1,500, the first time since November 2025
- Palladium: $1,035.50, down 1.0%; futures hit a 52-week low of $1,010.50
- Fed funds target range: 3.75%–4.00% (effective rate 3.88%)
- Chance of no change on Wednesday (CME FedWatch): about 91%
- US 10-year Treasury yield: 4.99%; 10-year real (inflation-protected) yield: 2.64%
- US consumer price inflation: 3.7% (September)
Prices at the New York close, Tuesday 27 October 2026. The charts below update live.
I. This week: the Fed and inflation
The Fed’s two-day meeting began today. The decision is due at 2:00 PM ET on Wednesday 28 October, followed by Chair Kevin Warsh’s press conference, usually at 2:30 PM. Futures markets put the chance of no change at about 90.6%. The current target range is 3.75%–4.00%, after a quarter-point increase in September, the Fed’s first rate hike since July 2023.
A hold is not the story, then. The press conference is. Markets see roughly a three-in-four chance of another hike in December, up from about 40% a month ago. Anything Warsh says that confirms or pushes back on that will move bond yields, the dollar and gold within minutes.
It helps to separate two kinds of interest rates:
- The fed funds rate is the overnight rate the Fed sets. It moves money markets, the dollar and short-term trading almost immediately.
- Long-term rates, led by the 10-year Treasury yield, are set by bond investors. They drive mortgages, corporate borrowing and the wider economy. At 4.99%, the 10-year yield is more than a point above the fed funds rate, a sign that investors expect inflation and borrowing to stay high for years, not months.
On Thursday 29 October at 8:30 AM ET, the Commerce Department publishes the September PCE price index, the Fed’s preferred inflation gauge. Consumer prices rose 3.7% in the year to September, driven by a 20.4% jump in energy prices; core inflation, excluding food and energy, was 2.6%. A hot PCE reading would make a December hike more likely. Dates and gold’s past reactions to each release are on the economic calendar.
II. The political backdrop: midterms and discord
Americans vote on Tuesday 3 November for all 435 House seats and about a third of the Senate. Nearly 33 million people had already voted by Tuesday afternoon, according to the University of Florida’s Election Lab. In the 27 states that register voters by party, 45% of early ballots came from registered Democrats, 31% from Republicans and 24% from neither. That says little about the result: Republicans have tended to vote in person on Election Day, and analysts warn against reading early ballots as a forecast.
For markets, uncertainty may matter more than the result itself. Three windows stand out:
- The count. Close House races, recounts and court challenges can leave control of a chamber unclear for days or weeks.
- 3 January 2027. The new Congress is sworn in and the House elects its Speaker. In January 2023 that took 15 rounds of voting. A narrow or disputed majority could repeat that.
- The run-up to 2028. There is no presidential inauguration this cycle; the next presidential election is on 7 November 2028. A divided Congress would shape the budget fights between now and then.
Some analysts see these events as symptoms of something longer-running: decades of widening political division and falling trust. The numbers support the trend. In Pew Research Center’s latest survey, 17% of Americans said they trust the federal government to do what is right most of the time, down from 77% in 1964. The figure has not been above 30% since 2007, and trust now swings sharply depending on which party holds the White House. Others point out that contested results have so far been settled by courts and certification, and that markets have usually looked past election noise.
Gold’s own record around midterms is mildly positive. Since 1970, gold was higher three months after a midterm in 9 of 14 cases, with a median gain of 3.9%. That is better than the 1.0% median for any three-month period, though 14 cases is a small sample.
III. The metals: testing the bottoms
Gold slipped below $4,000 on Friday and again in today’s session, but closed back above it, at $4,060.84. If the level gives way, the bears’ next markers are $3,800, about 6% lower, and $3,500, about 14% lower, a level that would take an extreme burst of volatility to reach. Gold futures’ 52-week low is $3,901.30. The metal is about 24% below its January record close.
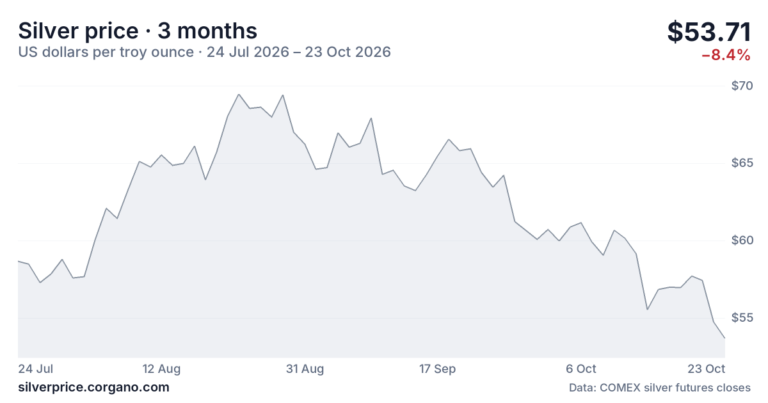
Silver closed at $54.45 and is still searching for a base. The levels traders watch are $52 (about 4.5% lower) and $50 (about 8% lower). A deeper flush could reach $40, about 27% below today and under the 52-week futures low of $46.33. On one widely used chart, silver’s 14-day relative strength index (RSI) was around 29 today, just inside the conventional “oversold” zone below 30.
Platinum has had the hardest fall. Futures dropped below $1,500 an ounce today for the first time since 21 November 2025, before spot recovered to $1,543.46. That is about 45% below its 52-week high. One ounce of gold bought about 2.4 ounces of platinum in September, against a long-run average of 0.9, more than in 97% of months since 1960.
Palladium, at $1,035.50, is back near $1,000, the level it first fell through in November 2023, and its futures set a 52-week low of $1,010.50 today. Both platinum and palladium show RSI readings in the low 20s, deeply oversold. Oversold markets can stay oversold, but readings this low have often come near short-term lows.
IV. Why gold doesn’t simply fall when rates rise
“Rates up, gold down” is a rule of thumb that history keeps breaking. The Fed raised rates by 5.25 points between March 2022 and July 2023, and gold still ended the cycle slightly higher before going on to records. Through the 2004–06 hikes, gold rose 49%. This year, though, the rule has held: gold is down about 7% since September’s hike.
What matters more is the real interest rate: the return on a safe bond after inflation. Gold pays nothing, so it competes with that return. Today there are three ways to measure it, and they give different answers:
- Fed funds minus inflation: 3.88% − 3.7% ≈ 0.2%. On this measure real rates are barely positive.
- 10-year Treasury minus current inflation: 4.99% − 3.7% ≈ 1.3%.
- The 10-year TIPS yield, the real return the bond market prices directly: 2.64%. That is higher than in 98% of weeks since 2003.
The 1970s and early 1980s show why the distinction matters. Through the 1970s inflation kept real rates near or below zero, and gold rose from $35 an ounce in 1971 to a record $850 on 21 January 1980. Under Fed Chair Paul Volcker, rates went higher than inflation and stayed there. The 10-year yield peaked at 15.84% in September 1981, and by the end of that year it was almost 14% with inflation below 9%: a real return of about 5%. Gold fell 32.6% in 1981 alone, 38% after inflation.
The bullish case argues that investors only abandon gold for Treasuries when real returns clear about 3%. On the backward-looking measures, real rates are nowhere near that. On the market’s own measure, at 2.64%, they are close. Gold has held up far better than past real yields would imply, though: on the 2006–2021 relationship, a 2.64% real yield would put gold near $681. It is about six times that, a gap usually explained by central-bank buying and demand for assets outside the financial system.
V. The investment thesis
In the short term the pressure on precious metals is real: a Fed that has started raising rates again, a 10-year yield near 5%, inflation driven by energy, and political noise that could last into January. The bottoming argument rests on several pieces:
- Positioning: silver, platinum and palladium are deeply oversold.
- History: gold has tended to rise in the months after midterm elections.
- Distrust: distrust of government has risen for decades, which tends to support assets that are no one’s liability.
- Real rates: on the measures that use today’s inflation, they are still low.
The case against is mainly the 2.64% real yield and the chance of further Fed hikes.
The levels to watch are simple. For gold, a close back above about $4,180 would undo last week’s break; a sustained move below $4,000 opens the way to $3,800. For silver, it’s $50. Wednesday’s press conference, Thursday’s PCE data and next week’s vote will probably decide which comes first.
Live prices and history are on goldprice.corgano.com and silverprice.corgano.com. How gold has reacted to every Fed meeting without a change since 1994 is on the gold after Fed holds page.
Data: Corgano Gold Price — gold price history, as of October 28, 2026, 09:22 UTC.
Prices and figures come from the Corgano price sites and the sources linked above and are indicative. This article is commentary on market conditions; it is not investment, tax or financial advice.