Gold is about 24% below its January record close and is fighting to hold $4,000 an ounce, which puts it in a bear market by most technical measures. With oil above $100, rate-hike odds rising and near-record margin debt behind an AI-led stock market, the bigger near-term risk may be a forced-selling episode that drags gold lower before any long-term recovery.
Key figures
- Gold, 1 troy ounce: $4,060.84, up 1.1% today; about 24% below its record close of $5,318.40 (29 January)
- Gold over the past week: −1.7%; so far in 2026: −6.2%
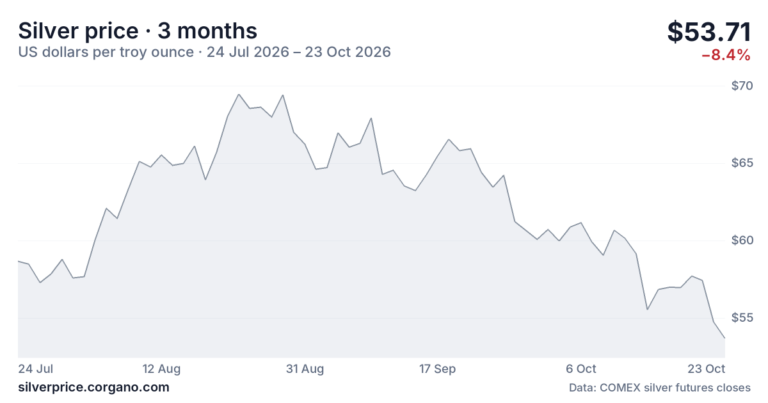
- Silver, 1 troy ounce: $54.45, up 0.9% today; about 55% below its January high above $120; 2026: about −23%
- Bitcoin: about $81,100; 2026: about −9%
- Gold/silver ratio: 74.6
- WTI crude: $100.20 (−1.5% today); Brent near $114, down from above $117 last week
- US 10-year Treasury yield: 4.99%
- S&P 500: 7,722.60 (+0.6% today); Nasdaq 100: +1.2% today
- US margin debt: $1.48 trillion (FINRA, September), just below June’s record of $1.50 trillion
Prices at the New York close, Tuesday 27 October 2026 (5:00 PM ET). The charts and tables below update live.
From record to bear market in nine months
Gold opened 2026 with one of the most violent rallies in its history. A January surge took it to a record close of $5,318.40 on 29 January, and intraday trade came close to $5,600. Nine months later the whole run has been given back, and then some. At today’s close of $4,060.84 gold is down 6.2% on the year and about 24% below its record close, or roughly 27% measured from the intraday extreme.
On Friday, spot gold slipped below $4,000 for the first time since mid-July. That capped the metal’s worst week in five months, a 4.4% drop. The level is now being tested. Gold dipped to about $3,990 in today’s session before buyers stepped in, and it closed up 1.1% as oil eased ahead of tomorrow’s Fed decision. The bear-market call rests on the 150-day moving average, the trend gauge many technical analysts use to separate bull phases from bear phases. Gold and silver are both trading below it. By the plainer rule of a 20% fall from the high, gold qualifies as well.
Gold's highest daily close on record: $5,318.40 per ounce, on 29 January 2026. (Daily closes since 2000.) Gold price history →
Where the bears see a floor
The $4,000 line matters partly because it is round, and round numbers attract orders. Gold dipped below it in June, in July and again in October, and each time buyers pulled it back above. It could act as a support zone again. But in the bearish reading the trend is still down, and support is a pause, not a turn. The downside targets in that view are $3,300 and, in a deeper flush, $3,100. From today’s close those would mean further falls of about 19% and 24%. They would take gold back to prices last seen in the summer of 2025, before its run to records.
There are reasons to doubt that a straight-line drop is coming:
- Positioning is already stretched. Hedge funds are close to a net short position in gold futures, and BCA Research’s Roukaya Ibrahim said her indicators point to a rebound. Crowded shorts can produce sharp, short-covering rallies. The weekly CFTC data is on the gold COT report page.
- Official buying hasn’t stopped. Goldman Sachs estimated that central banks bought 79 tonnes in August, against a pre-2022 monthly average of 17 tonnes.
- The big banks never followed the price down. In late June, year-end targets were still well above spot: Deutsche Bank at $4,800 and Goldman at $4,900. The current list is on our gold price forecast page.
This explains why the same analysts who are bearish on the next few months stay bullish on the long term. In their view, a bear market inside a secular bull market produces the major cycle lows that turn into the best buying opportunities. Whether this one has already bottomed is the open question.
Silver: the higher-beta casualty
Silver has fared far worse. It peaked above $120 in late January and closed today at $54.45, up 0.9% on the day but still near its lowest levels since November 2025. That is a loss of about 55% from the high in nine months, and about 23% for the year. Silver behaves like gold with leverage: it has the same monetary story plus an industrial one that suffers when growth fears rise.
The clearest sign is the gold/silver ratio. Around the January peaks it took roughly 45 ounces of silver to buy an ounce of gold. Today it takes 74.6. A ratio climbing that fast is typical of risk-off, deleveraging phases. The long-run context is on the gold/silver ratio history page.
Gold/silver ratio: 75.0 — one ounce of gold buys 75.0 ounces of silver. Gold/silver ratio since 1968 →
Oil above $100: inflation that hurts gold instead of helping it
The bearish thesis expects crude to keep trading between $100 and $120 a barrel, and the market has been inside that band for weeks. Brent traded above $117 intraday last week after attacks on tankers near the Strait of Hormuz. It has eased since, to around $114, on hopes for regional diplomacy: Saudi, Turkish and Pakistani officials met Iranian officials in Tehran on Monday. WTI closed today at $100.20. Even after the pullback, both benchmarks remain inside the range.
Inflation is usually the gold bull’s best friend. This time it works through the Fed. Year-ahead inflation expectations in the University of Michigan survey rose to 4.7%. At the end of last week, futures traders put the odds of a December rate hike at about 78%, and the 10-year Treasury yield is at 4.99%. Higher yields raise the cost of holding a metal that pays no income. So far in 2026 that effect appears to have outweighed gold’s role as an inflation hedge. That is also why today’s dip in oil helped gold.
Oil and gold are largely separate markets, but they meet at the mine. Diesel and power are among a miner’s biggest costs, so expensive energy squeezes margins just as the gold price falls. Newmont fell 8.2% last week despite reporting record third-quarter adjusted earnings of $2.20 a share. The gold-to-gas ratio tracks how much fuel an ounce of gold buys.
The AI trade: engine, bubble or both?
The comparison with 1999–2000 has become hard to avoid. Big Tech is spending hundreds of billions of dollars a year on AI data centres. So far the clearest profits have gone to the suppliers of chips and infrastructure, while the return for the companies doing the spending is still to be proven. Investors have started to ask how long that spending can continue.
AI is also the main thing holding up the US stock market. The thesis notes that the Nasdaq has traded sideways since May, and last week it touched a five-week low along with the S&P 500. Tech led a bounce today: the Nasdaq 100 rose 1.2%, and the S&P 500 gained 0.6% to 7,722.60, about 1.6% below its 52-week high. The thesis’s more striking claim is that the cycle may not be over yet. It sees room for a final, euphoric 15–20% rally before a major top.
One candidate trigger is now on the calendar. Anthropic, the maker of the Claude AI models, made its IPO filing public on 26 October. It plans to list on the Nasdaq under the ticker ANT, and its shares could begin trading as soon as the week of 16 November. The share count and price range have not yet been disclosed. Mega-listings tend to come when investors are most eager to buy. That is why some market historians treat them as late-cycle markers, although calling a top from them has a poor record.
For gold, both outcomes matter. A melt-up would pull money towards equities and away from defensive assets. The top that followed would be where the real danger lies.
Leverage and the liquidity trap
Investors have borrowed against their portfolios on a record scale. By FINRA’s count, US margin debt hit a record $1.50 trillion in June. July then brought the largest one-month dollar drop in the series’ history, about $85 billion. That was a small-scale deleveraging, and it coincided with gold’s lowest close of the year in mid-July. Borrowing has since climbed back to $1.48 trillion in September, roughly 140% above its end-2022 low. The build-up included a 15.9% jump in April and May alone. Two-month surges of that size were also seen in January 2000 and May 2007.
The picture is less extreme than the headline. Measured against the size of the market, margin debt was 2.3% of S&P 500 market value in the second quarter, about its average since 1997. Leverage has grown with prices more than it has run ahead of them. The risk is less the level than what happens if prices fall quickly.
The mechanism is simple. When a leveraged stock portfolio drops, the broker asks for cash. Investors sell what is liquid and still worth something, and that is often gold. Last week gave another small preview: losses in tech stocks triggered margin calls, and gold and silver were sold to raise cash, even as stocks touched multi-week lows. In a full liquidity event, gold can fall alongside everything else for a time, even when its long-term trend is up.
History shows how this tends to play out. In 2008, gold fell roughly 30% between March and late October as funds were forced to deleverage. It then went on to new records over the next three years. In March 2020’s dash for cash it lost about 12% in under two weeks, then set a record by August. Here is where gold stood at the low of the 2008 deleveraging, compared with today:
On 24 October 2008, gold closed at $729.10 per ounce. Today's price is 456% higher. Gold prices in October 2008 →
Bitcoin is the most leverage-sensitive of the three assets tracked here. At around $81,100 it is down about 9% this year. It trades largely as a high-beta tech asset rather than a haven, and one bitcoin buys about 20 ounces of gold. Spot ETF demand is tracked on the bitcoin ETF flows page. The table below shows how the three have moved over different time frames:
Price 1 month This year 1 year 5 years Gold $4,054.04 /oz −2.7% −6.4% +1.8% +124.9% Silver $54.05 /oz −11.7% −23.4% +16.1% +123.4% Bitcoin $81,318 −2.6% −8.4% −28.0% +34.1%
What to watch
- Fed decision, Wednesday 28 October, 2:00 PM ET. The two-day meeting began today. A hold at 3.75–4.00% is widely expected, so the guidance on December matters more. Dates and gold’s past reactions are on the economic calendar.
- PCE inflation, Thursday 29 October, 8:30 AM ET. Another hot reading would firm up hike bets.
- $4,000 and $4,181. Gold held $4,000 at today’s close. A settlement in December gold futures back above the $4,181.10 level of 16 October would challenge the bear case. A sustained break below $4,000 opens the way to the lower targets.
- Brent above $110. Oil staying in that range keeps pressure on the Fed and on mining margins.
- The Anthropic IPO. The pricing and first-day trading will show how much appetite for AI risk is left.
- Margin debt. FINRA’s October figures, due in November, will show whether the rebuilding of leverage after July has continued.
The bottom line
Gold is in a bear market, but not necessarily a broken one. The forces pushing it down right now are rising yields, oil-driven rate-hike risk and the chance of forced selling if an over-borrowed, AI-heavy stock market cracks. They are mostly cyclical. They can push the price back below $4,000 before they run their course, and a liquidity event could bring a sharp drop exactly when gold is meant to protect a portfolio. The long-term case behind the 2024–26 bull market has not gone away, though, and lows set in these conditions have tended to become the reference points for the next advance. Expect volatility before resolution.
Follow the live price on goldprice.corgano.com, see each day’s move explained on why is gold up or down today, and track silver and bitcoin alongside it.
Data: Corgano Gold Price — gold price history, as of October 28, 2026, 09:22 UTC.
Prices and figures come from the Corgano price sites and the sources linked above and are indicative. This article is commentary on market conditions; it is not investment, tax or financial advice.